Capturing Errors From Browsing Console
This guide will show you how to fetch your web browser console error logs.
Step 1: Navigate to a Web Page
Open your web browser (Google Chrome, Mozilla Firefox, Microsoft Edge, or Safari) and go to any web page you’d like to inspect.
Step 2: Access Developer Tools
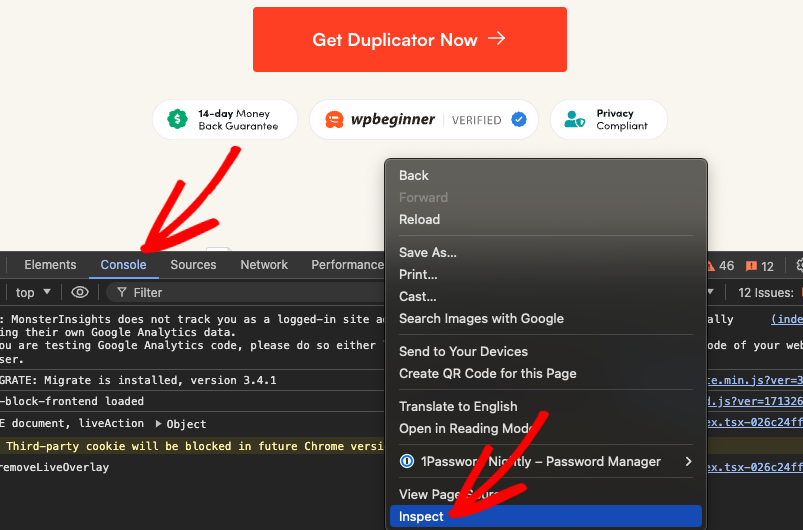
Right-click anywhere on the web page, and a context menu will appear. From this menu, select “Inspect” or “Inspect Element.” This opens the developer tools. Now, you can navigate to the “Console” Tab.

Capturing Errors in the Browser Console

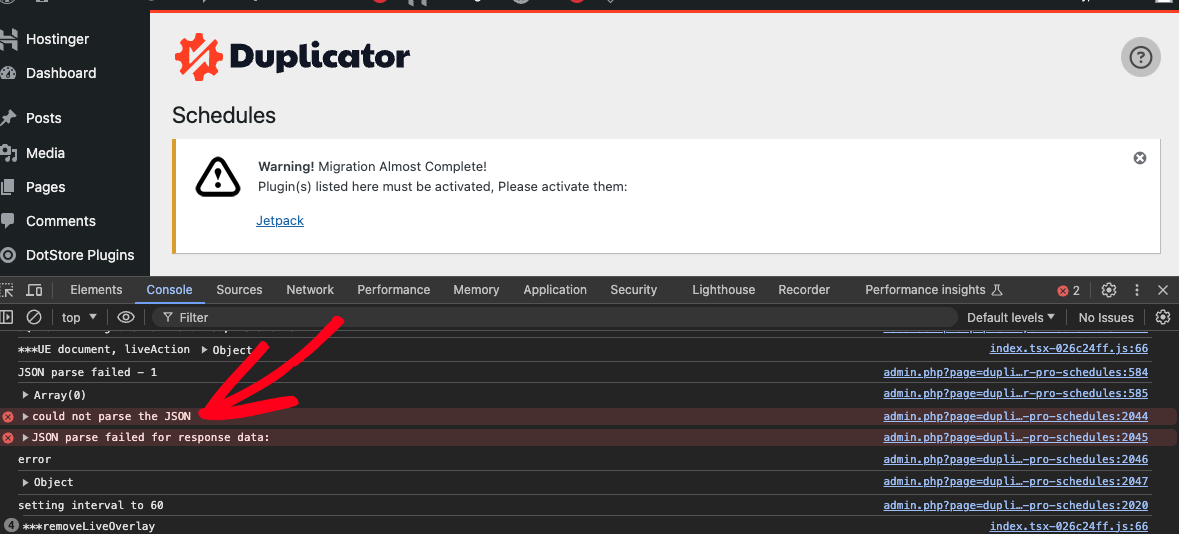
Errors are usually accompanied by descriptive messages. Look for lines in red, which often indicate an issue. These messages might include details about what went wrong. You can now copy the error from the Console tab and share it with the Support Team.


