
Filtering and Searching Your Activity Log
The Activity Log records every event on your site, and over time that list can get long. The filter bar and search field let you quickly zero in on exactly what you’re looking for — whether that’s every failed login attempt, everything a specific user did last week, or all plugin changes made this month.
This guide covers the filter bar, the quick date shortcuts, the search field, and how to sort and paginate the results.
The Filter Bar
The filter bar sits just below the search field and gives you four dropdown filters, combinable in any order.
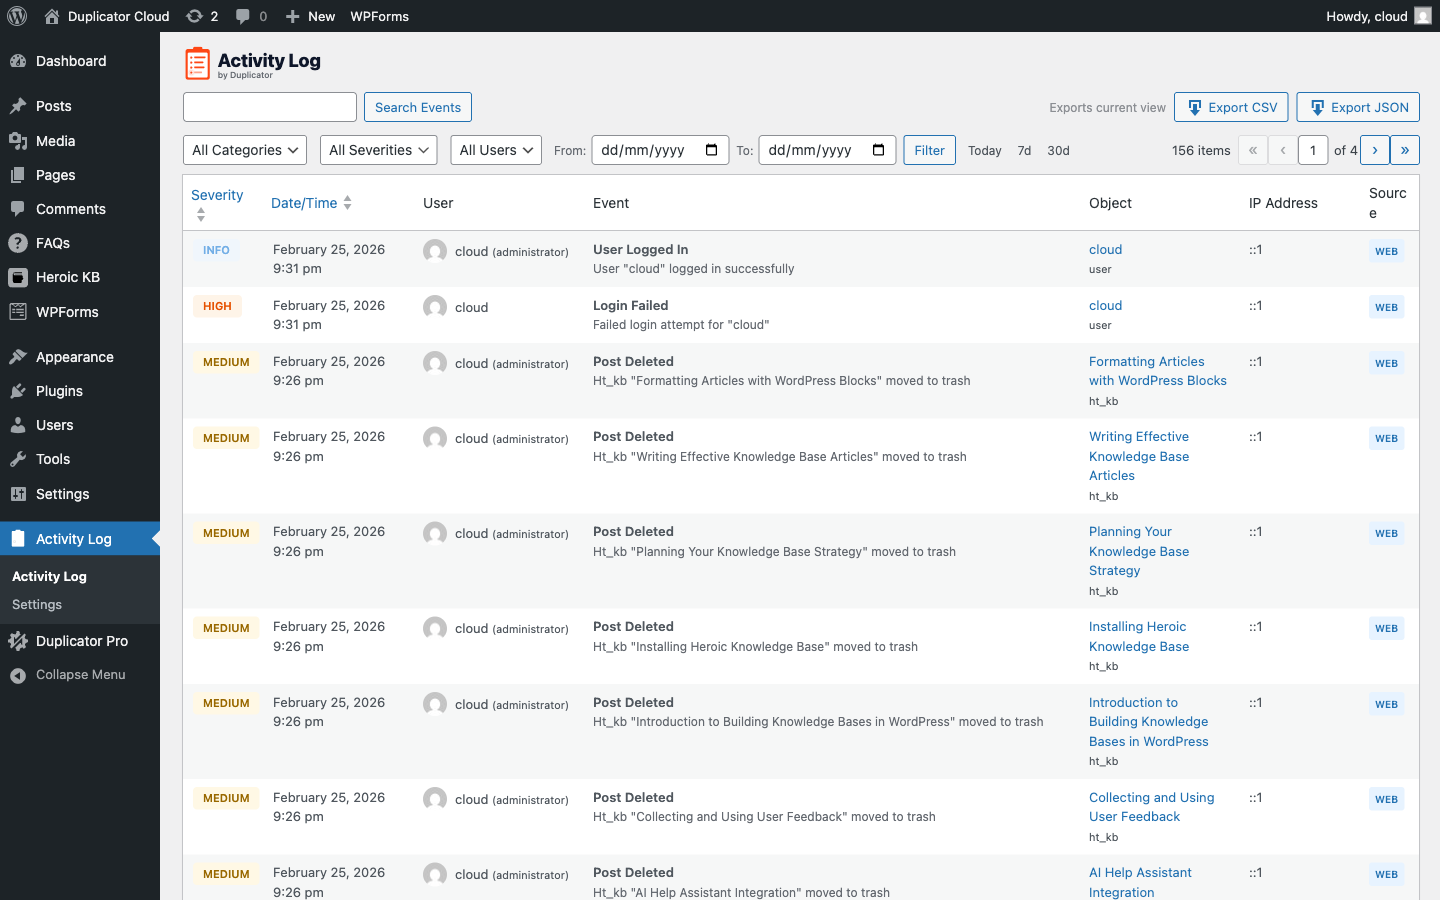
- All Categories:
Filter by event category. Choose from User, Content, Media, Plugin, Theme, WordPress, Appearance, Taxonomy, or Settings. Selecting a category shows only events in that group. - All Severities:
Filter by severity level, Info, Low, Medium, High, or Critical. Useful for quickly finding security events (High) or routine activity (Info). - All Users:
Narrow the log to a specific user’s actions. Every registered user on the site appears in this list, regardless of role. - From / To:
Set a date range using the date pickers. Use both fields together to view activity within a specific window, or just set a From date to see everything since that day.
Once you’ve set your filters, click the Filter button to apply them. To reset, clear the filters and click Filter again.
Quick Date Filters
To the right of the Filter button, you’ll find three quick-access date shortcuts:
- Today:
Shows only events from the current calendar day. - 7d:
Shows events from the last 7 days. - 30d:
Shows events from the last 30 days.
These shortcuts instantly apply a date filter without needing the date pickers, useful for a fast daily or weekly review.
Searching Events
The Search Events field at the top-left searches across event descriptions, object names, and usernames. For example, searching for wpforms returns any event where that word appears in the event description or object name, and searching for a username returns every event by that user.
Combine search with the dropdown filters for even more precision. For example, search for login and filter by High severity to see only failed login attempts.
Sorting the Results
Click the Date/Time column header to toggle between newest-first and oldest-first order. By default, the log is sorted by Date/Time, newest first.
Click the Severity column header to sort by severity level. This sorts alphabetically by severity name (Critical, High, Info, Low, Medium in ascending order), not by actual severity rank, so it won’t group Critical and High together at one end unless you account for the alphabetical order.
The log shows 50 events per page by default. Change this under Activity Log › Settings › General, from 10 to 100 per page. See Configuring Activity Log Settings for the full list of options on that page. Use the page navigation arrows in the top-right of the table to move between pages.
That’s everything you need to find any event in your log.
Filtered results also export to CSV or JSON for offline review. See Exporting Your Activity Log Data for details.