
Navigating the Activity Log: Main Page Overview
Once the Activity Log plugin is installed and active, every change on your site is recorded and displayed in a clean, sortable log. This article walks you through the main log page so you know exactly where to find things and what each column means.
This covers accessing the log, reading the log table columns, understanding severity levels, and using the dashboard widget.
Accessing the Activity Log
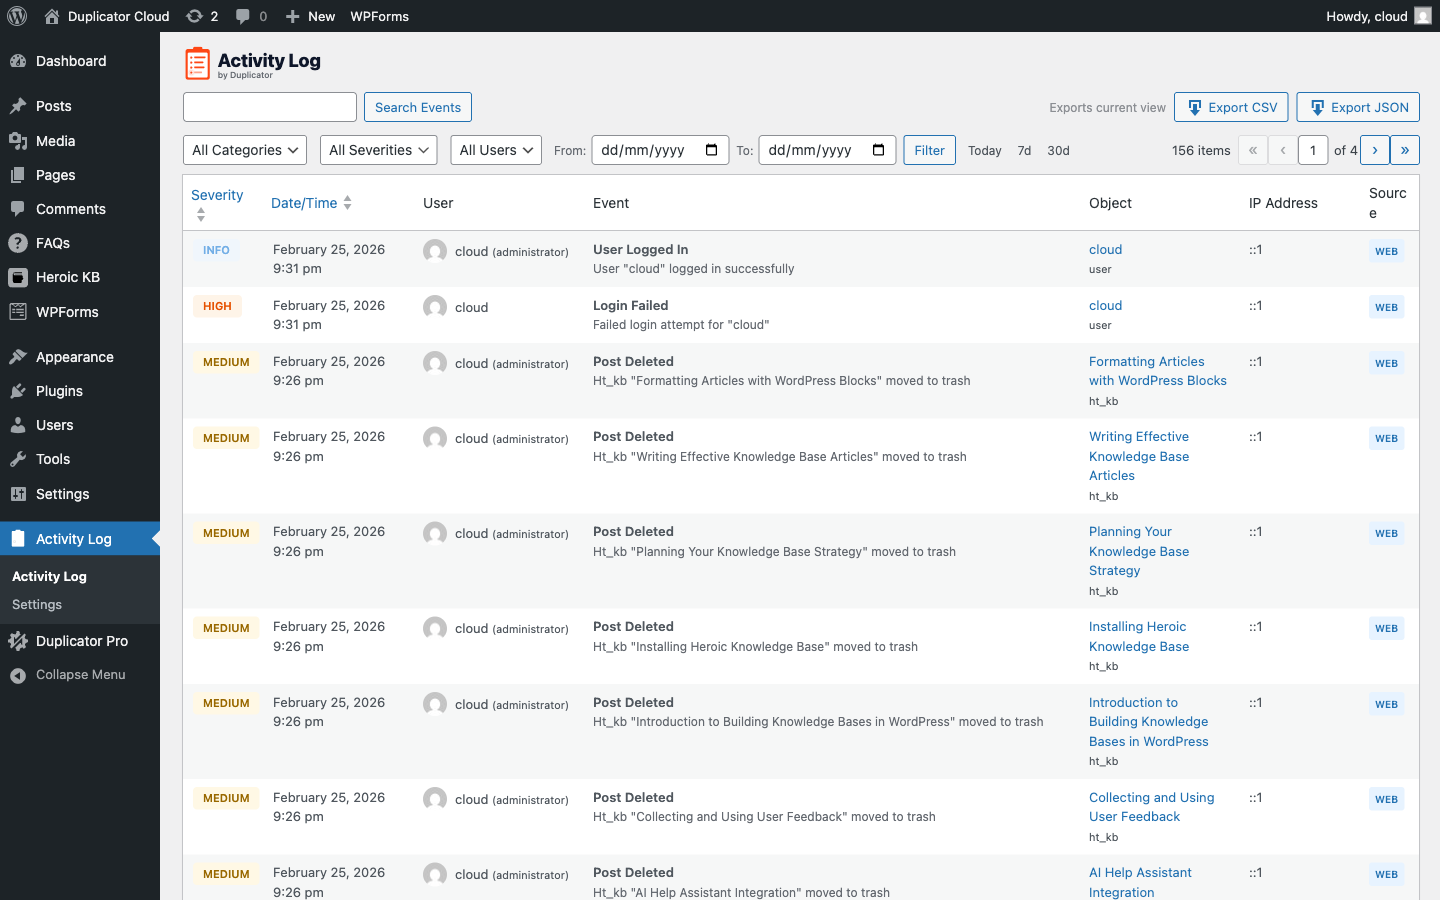
In your WordPress admin sidebar, click Activity Log. You’ll land on the main log page, which lists every recorded event on your site in reverse chronological order.
The Log Table
Each row in the log table represents a single event. Here’s what each column shows:
- Severity:
A color-coded badge showing how significant the event is (Info, Low, Medium, High, or Critical). Sortable, click the column header to sort by severity. - Date/Time:
When the event occurred, displayed in your site’s local timezone. Sortable, click this column header to toggle between newest-first and oldest-first sorting. - User:
The WordPress user who triggered the event, shown with their avatar and role. System-generated events show as System. Not sortable. - Event:
A human-readable description of what happened, including the affected object. For example: Plugin “WooCommerce” activated. Not sortable. - Object:
The name of the item that was affected, a post title, plugin name, username, or setting name, with the object type shown underneath in small text. Clickable when the object still exists on your site. Not sortable. - IP Address:
The IP address the request came from. Not sortable. - Source:
How the action was triggered, Web for browser requests or CLI for WP-CLI commands. Not sortable.
Understanding Severity Levels
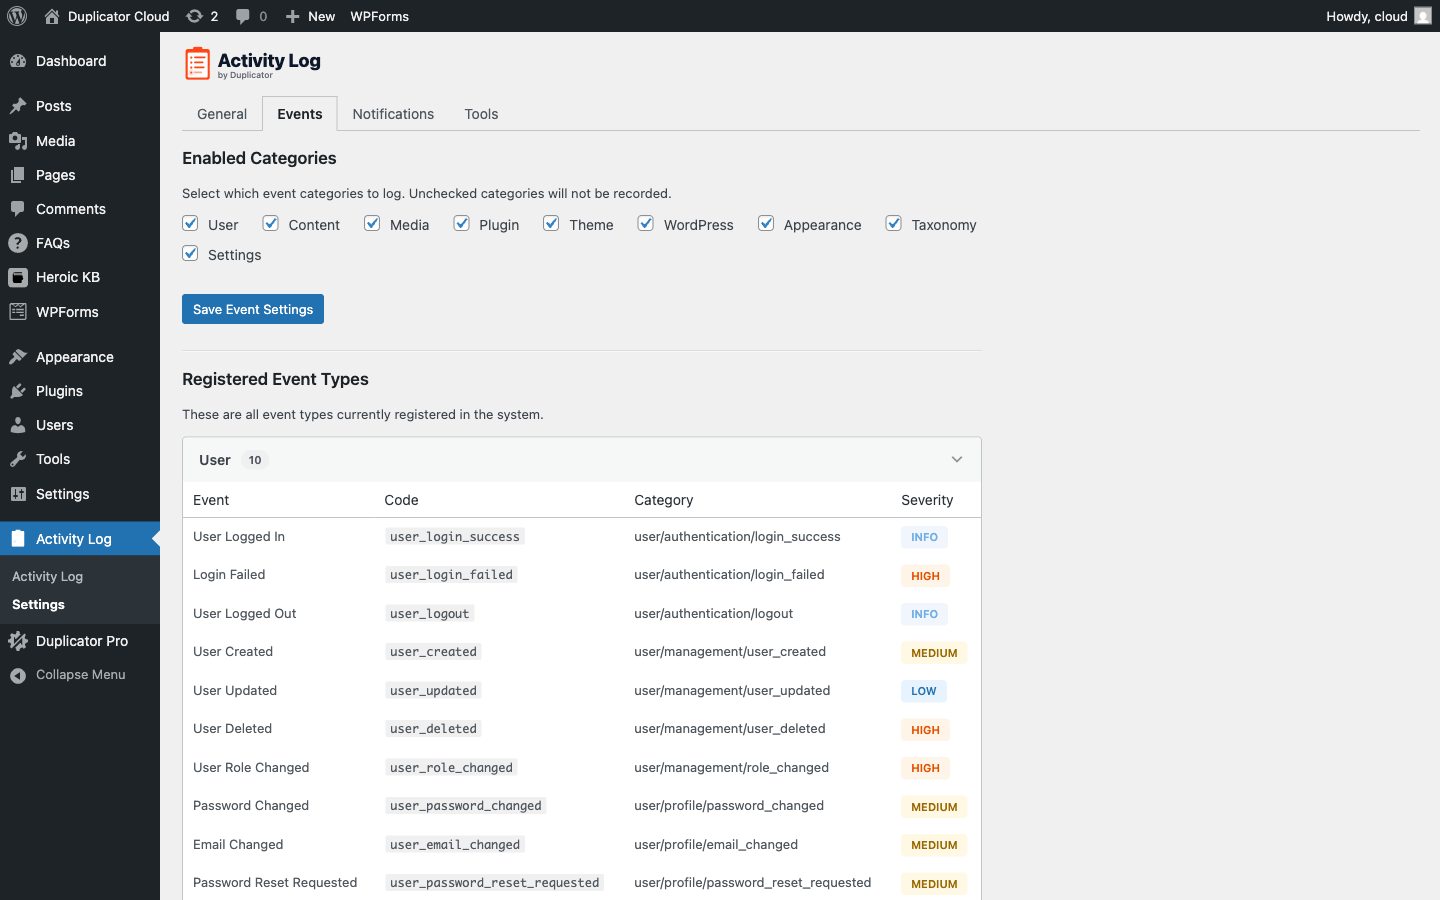
Activity Log uses five severity levels to help you quickly spot what matters:
- INFO (light blue):
Routine events like successful logins and logouts. - LOW (blue):
Minor changes such as post updates, widget edits, and media uploads. - MEDIUM (yellow):
Notable changes including publishing posts, activating plugins, and switching themes. - HIGH (orange):
Security-relevant events, failed logins, user deletion, role changes, plugin deletion, and critical settings changes. - CRITICAL (red):
Reserved for the most serious events. Not currently in use in version 1.0, available for future use
The Dashboard Widget
Activity Log also adds a Recent Activity widget to your WordPress dashboard, showing the last 10 events at a glance. You’ll see the event name, the user who triggered it, and how long ago it happened. Click View All Activity → to jump straight to the full log.
Next, learn how to filter and search your activity log to find exactly what you’re looking for.
The log shows 50 events per page by default. See Configuring Activity Log Settings to change the per-page count.