How do I read the backup trace log?
The trace log file shows a detailed list of operations of the Duplicator application for more advanced debugging. It’s used to diagnose issues related to license activation failures, storage creation issues, and backup build initiation issues.
Turning on the Trace Log
There are two ways to turn on the trace log:
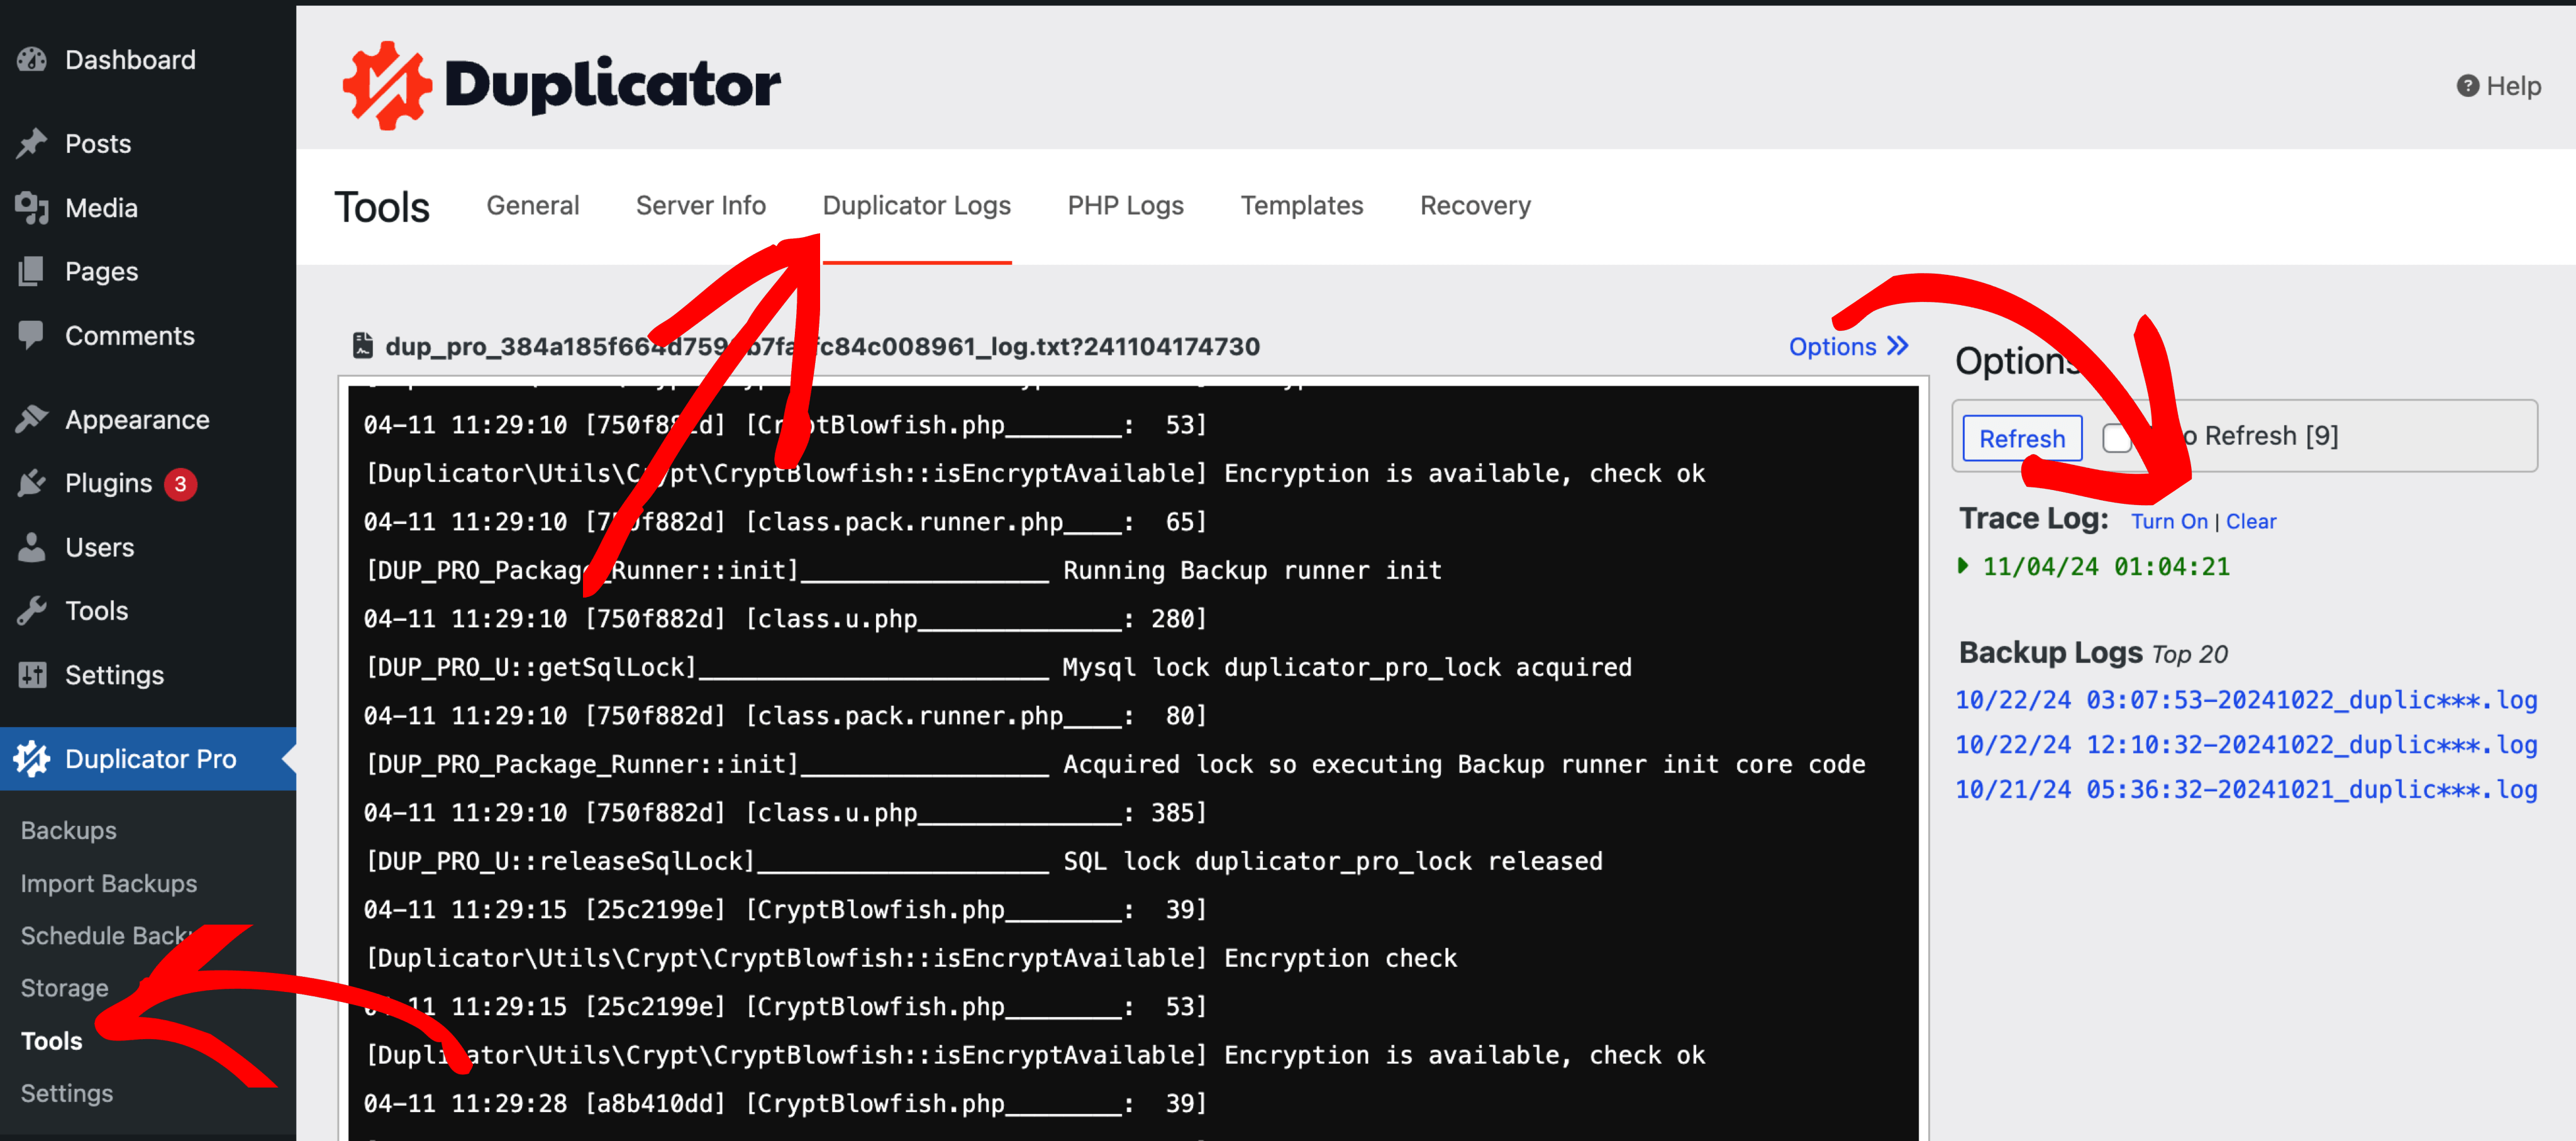
Turning on the trace log from Duplicator » Tools
- Turning on the trace log will make the options visible for Trace logs.

Turning on the trace log from Duplicator » Settings
- Go to Duplicator » Settings » General » Debug.
- Select On or On (Enhanced) for the setting Trace Log, and save the settings.

Generating and downloading the Trace Log
From Duplicator Pro » Settings
- Save the .zip file to your local machine and turn off the trace log again if it’s no longer needed.
From Duplicator Pro » Tools
- Go to Duplicator » Tools » general
- Click the button Get Diagnostic Data
- Go to Duplicator » Tools » Duplicator Logs
- In the right sidebar, click the anchor labeled with the trace log file name below Trace Log
- From the right area where the trace log content is displayed, you can copy the trace log content, and paste it into a .txt file
From the Trace log options
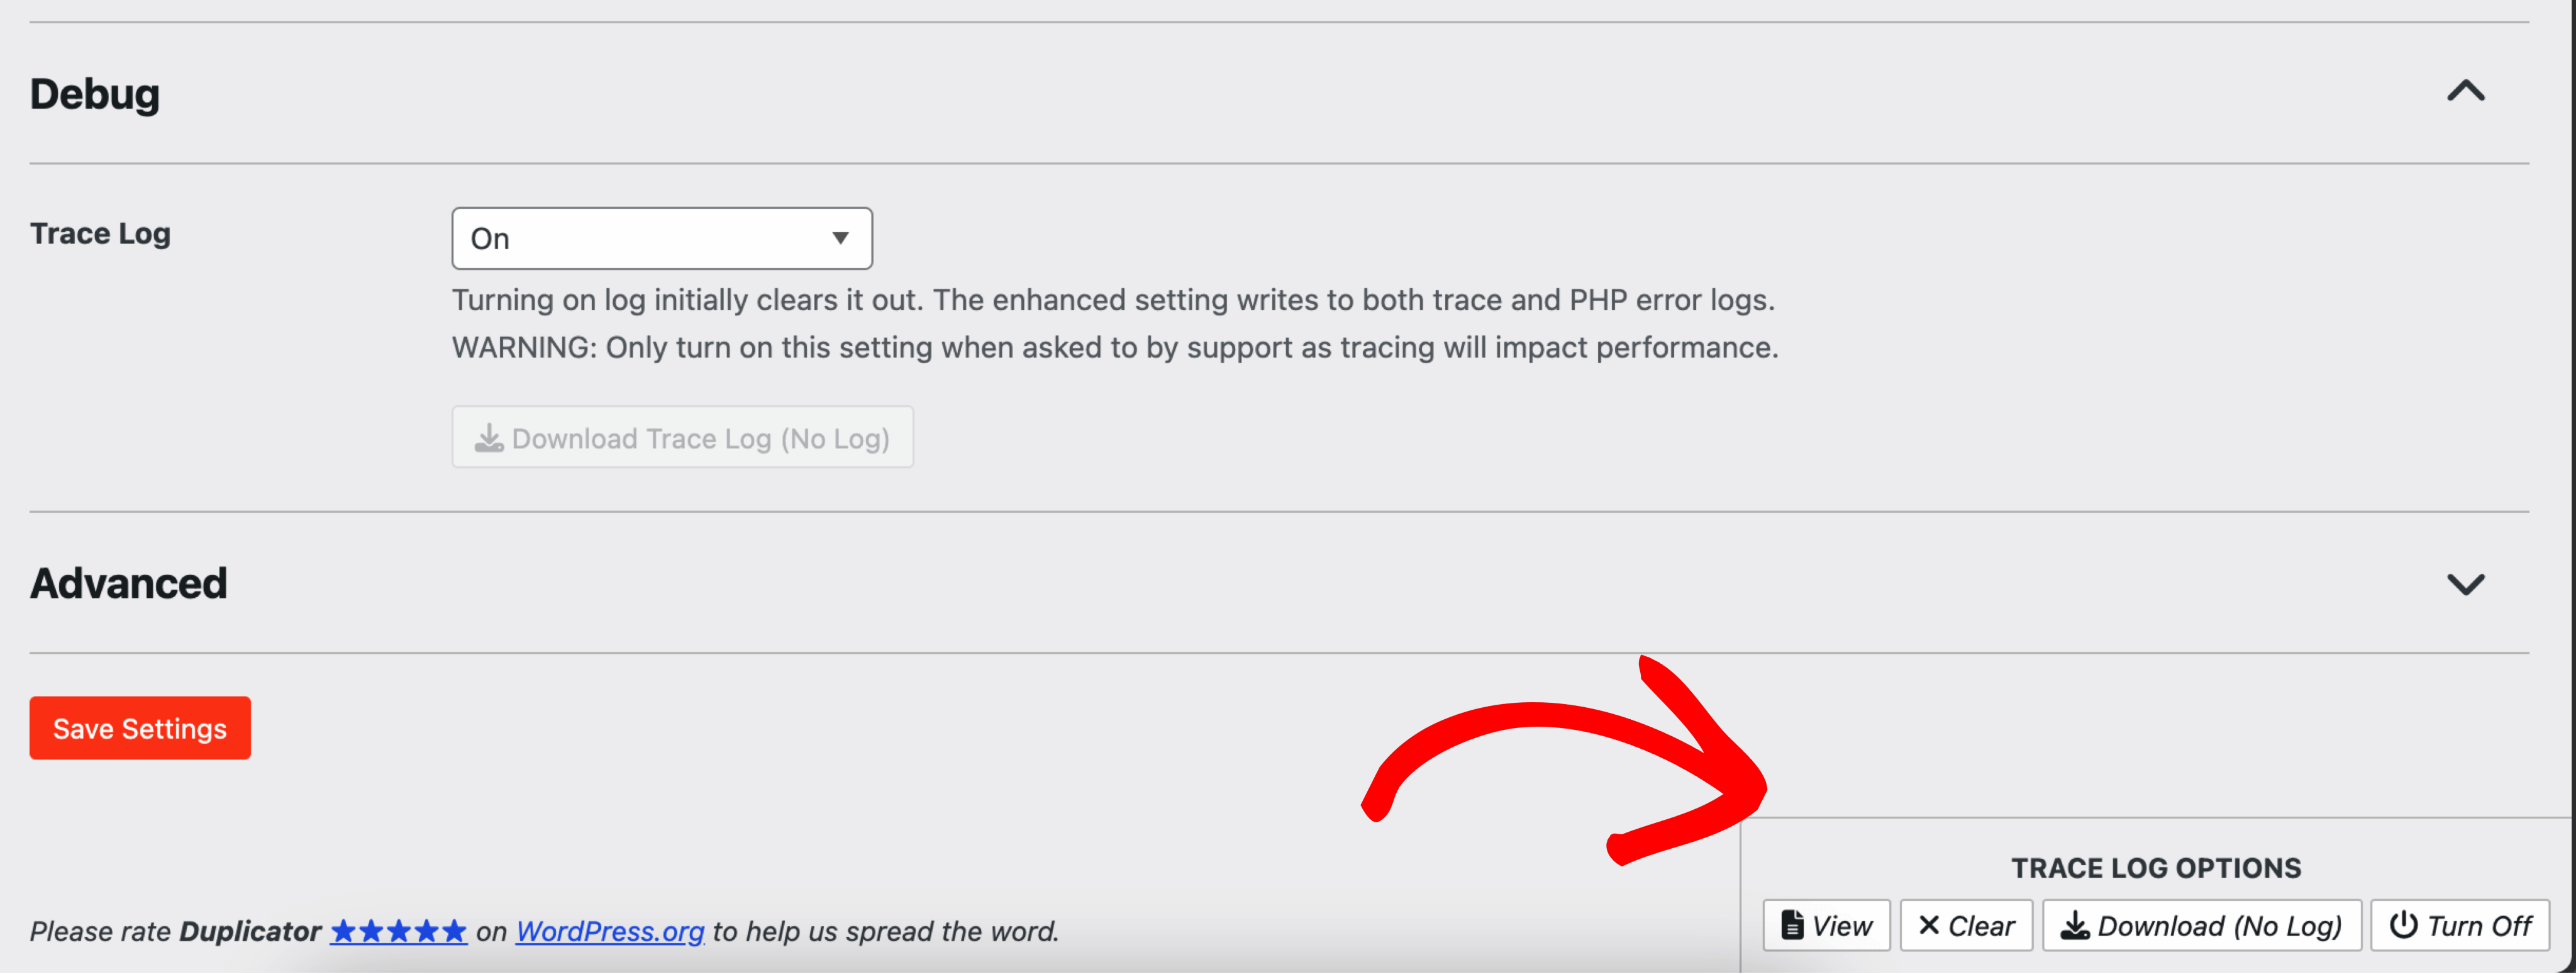
When trace logging is enabled, Duplicator displays the Trace options in the bottom right corner of all Duplicator pages in the admin dashboard. To download the trace log to your local machine, simply click the “Download” button.
Navigate to this section for more information about the Trace log options.
Enhanced Settings
The On (Enhanced) setting writes to both trace and PHP error logs.

Trace Log Options
When the Trace Log is enabled, you’ll find options in the bottom right corner in all the Duplicator pages to view, clear, download, or disable the trace log.
- View: To see the log live on our built-in interface.
- Clear: To clear the log and generate a new one with the error point.
- Download: To download the zip file. Name: duplicator_pro_log.zip.
- Turn off: To turn it off.

Sharing the Trace log file with support
If you’re troubleshooting an issue and wish to share the trace log with the Duplicator support team, follow these steps:
- Enable the Trace Log:
- Reproduce the Issue:
- Replicate the issue you are experiencing. For example, if you are encountering a storage creation issue, attempt to create a new storage and allow it to fail so that Duplicator can record the process in the trace log file.
- Replicate the issue you are experiencing. For example, if you are encountering a storage creation issue, attempt to create a new storage and allow it to fail so that Duplicator can record the process in the trace log file.
- Download the Trace Log:
- Turn Off the Trace Log:
- Once you’ve shared the necessary information, be sure to turn off the trace log.


