
Comment déboguer WordPress : trouvez et corrigez les erreurs rapidement
 Joella Dunn
Joella Dunn
Joella Dunn
 John Turner
John Turner
John Turner
Que vous soyez un développeur chevronné ou un propriétaire de site curieux, le débogage est votre arme secrète pour un site web plus sain et plus performant.
Dans ce guide, nous plongeons dans le monde du débogage WordPress. Ne vous inquiétez pas, ce n'est pas aussi effrayant que cela en a l'air. Je vais vous expliquer ce qu'est le débogage, pourquoi il est important et comment le faire efficacement.
À la fin de cet article, vous aurez les connaissances nécessaires pour repérer et corriger les erreurs afin que votre site WordPress continue de fonctionner sans problème.
Voici les points clés à retenir :
- WP_DEBUG est le mode de diagnostic intégré de WordPress. L'activer affiche les erreurs, les avertissements et les notifications qui sont masqués par défaut sur un site normal.
- Il existe 5 façons d'activer le débogage : un plugin, des modifications manuelles du fichier wp-config.php, SCRIPT_DEBUG pour les fichiers front-end, la journalisation des requêtes de base de données et le rapport d'erreurs PHP.
- Le débogage ne doit être activé que temporairement — et idéalement sur un site de staging, jamais sur un site en production — afin d'éviter d'exposer des informations sensibles ou de nuire aux performances.
- Les sauvegardes sont votre filet de sécurité tout au long du processus de débogage. Des outils comme Duplicator Pro permettent de revenir facilement en arrière instantanément si une correction aggrave les choses.
Table des matières
Qu'est-ce que le débogage dans WordPress ?
Considérez le débogage comme un bilan de santé de votre site web. C'est le processus de recherche et de correction des problèmes dans le code de votre site WordPress.
Ces problèmes peuvent aller de petits contretemps à de gros maux de tête, notamment :
- Erreurs de syntaxe : lorsqu'il y a une faute de frappe ou une erreur dans le code
- Erreurs de logique : lorsque le code ne fait pas ce que vous attendez de lui
- Problèmes de compatibilité : lorsque différentes parties de votre site ne fonctionnent pas ensemble
- Goulots d'étranglement de performance : lorsqu'un élément ralentit votre site
Mais le débogage n'est pas seulement utile lorsque les choses tournent mal. C'est aussi un moyen puissant d'optimiser votre site, même lorsque tout semble aller bien. Le débogage peut vous aider à détecter les problèmes potentiels avant qu'ils ne deviennent de réels problèmes.
Ainsi, que vous essayiez de réparer un plugin défectueux ou que vous souhaitiez simplement rendre votre site plus rapide, le débogage est votre stratégie de prédilection. C'est une compétence essentielle pour quiconque souhaite maintenir un site WordPress sain et performant.
Pourquoi le débogage est-il important ?
Vous vous demandez peut-être : « Dois-je vraiment me soucier du débogage ? » La réponse courte est oui, et je vais vous expliquer pourquoi.
Maintient le bon fonctionnement de votre site
Le débogage régulier, c'est comme un entretien de routine. Il vous aide à détecter les petits problèmes avant qu'ils ne deviennent de gros problèmes coûteux. En corrigeant les petits problèmes tôt, vous maintenez le bon fonctionnement de votre site.
Améliore les performances
Avez-vous déjà visité un site web lent ? Frustrant, n'est-ce pas ?
Le débogage peut vous aider à identifier ce qui ralentit votre site. Il peut s'agir d'un plugin volumineux ou d'une requête de base de données inefficace. Une fois que vous connaissez le coupable, vous pouvez le corriger et donner un coup de fouet à votre site.
Renforce la sécurité
Les pirates adorent exploiter les vulnérabilités des sites web. Le débogage peut vous aider à repérer les failles de sécurité potentielles. En les corrigeant, vous renforcez la sécurité de votre site.
Améliore l'expérience utilisateur
Un site bogué peut faire fuir les visiteurs très rapidement. Un débogage régulier garantit que votre site fonctionne comme il se doit, gardant vos visiteurs satisfaits et fidèles.
Fait gagner du temps (et évite des maux de tête) à long terme
Bien sûr, le débogage prend du temps au départ. Mais ce n'est rien comparé au temps que vous passerez à gérer un crash majeur de votre site ou à essayer de comprendre pourquoi votre dernière mise à jour a tout cassé.
Facilite les mises à jour
Lorsque votre site est bien entretenu grâce à un débogage régulier, l'application des mises à jour se déroule beaucoup plus facilement. Vous êtes moins susceptible de rencontrer des problèmes de compatibilité ou des dysfonctionnements inattendus.
Qu'est-ce que WP Debug ?
WP_DEBUG est un mode de débogage intégré à WordPress. Considérez-le comme un interrupteur qui active le mode diagnostic de votre site. Lorsqu'il est activé, il vous aide à repérer les problèmes qui pourraient se cacher sous la surface.
Voici ce que WP_DEBUG peut faire :
- Découvrir les erreurs qui pourraient faire planter votre site
- Identifier les problèmes potentiels avant qu'ils ne causent des soucis
- Résoudre les conflits de plugins
- Déboguer du code personnalisé
- Écrire du meilleur code en voyant les erreurs au fur et à mesure du développement
N'oubliez pas que WP_DEBUG n'est qu'un outil dans votre arsenal de débogage, mais c'est un outil puissant. Utilisé judicieusement, il peut vous fournir des informations de débogage utiles afin que vous puissiez optimiser votre site WordPress.
Comment activer le débogage WordPress
Il existe plusieurs façons d'activer le débogage dans WordPress, chacune avec ses propres avantages. Nous allons parcourir ces méthodes une par une, en commençant par les plus simples et en passant aux techniques plus avancées.
Voici comment activer le débogage WordPress :
- Méthode 1 : Utiliser un plugin de débogage WordPress : L'option la plus simple pour les débutants ; des plugins comme WP Debugging activent le mode débogage avec une case à cocher, aucune modification de fichier requise
- Méthode 2 : Activer manuellement le débogage WordPress : Modifiez directement wp-config.php pour activer WP_DEBUG, enregistrez les erreurs dans un fichier avec WP_DEBUG_LOG, et masquez-les aux visiteurs avec WP_DEBUG_DISPLAY
- Méthode 3 : Utiliser SCRIPT_DEBUG : Force WordPress à charger les fichiers CSS et JavaScript complets non minifiés au lieu des versions compressées, ce qui facilite le suivi des erreurs front-end
- Méthode 4 : Activer la journalisation des requêtes de base de données : Utilise la constante SAVEQUERIES pour enregistrer chaque requête de base de données, son temps d'exécution et la fonction qui l'a déclenchée
- Méthode 5 : Vérifier les erreurs PHP : Active le reporting des erreurs PHP au niveau du serveur pour capturer les erreurs de bas niveau que les outils de débogage de WordPress pourraient ne pas révéler
- Méthode 6 : Vérifier doing_it_wrong() : Active les avertissements intégrés de WordPress pour l'utilisation incorrecte des API et des fonctions, avec le fichier exact et le numéro de ligne où le problème se produit
Méthode 1. Utiliser un plugin de débogage WordPress
Si vous débutez dans le débogage ou si vous préférez une approche conviviale, les plugins de débogage WordPress sont vos meilleurs alliés. Ils offrent un moyen simple et visuel d'identifier et de résoudre les problèmes sans avoir à plonger dans le code.
Un plugin simple est WP Debugging. Il activera le mode WP_Debug pour vous, vous n’aurez donc pas à vous soucier de la modification des fichiers.

Une fois activé, allez dans Outils » WP Debugging. Cochez la case à côté de Définir WP_DEBUG sur true. Enregistrez vos modifications.

Ensuite, vous verrez un nouveau bouton en haut de votre tableau de bord. Survolez Debug Quick Look et cliquez sur View File.

Cela ouvre le journal de débogage dans une nouvelle fenêtre. Vous pouvez le consulter pour toute erreur et les corriger rapidement.
Les plugins de débogage offrent une introduction douce au monde du dépannage WordPress. Ils sont parfaits pour les débutants ou pour des vérifications rapides des performances de votre site. Au fur et à mesure que vous vous sentirez plus à l’aise avec le débogage, vous voudrez peut-être explorer certaines des méthodes plus avancées que nous aborderons ensuite.
Méthode 2. Activer manuellement le débogage WordPress
Prêt à améliorer vos compétences en débogage ? Vous pouvez également activer manuellement le mode de débogage. Cette méthode vous donne plus de contrôle et d’aperçu sur ce qui se passe en coulisses.
Maintenant, vous devrez accéder à vos fichiers. Vous pouvez le faire via le gestionnaire de fichiers de votre hébergeur (comme cPanel) ou un client FTP.
Une fois que vous vous connectez à votre site, ouvrez le répertoire racine de WordPress (public_html). Trouvez le fichier wp-config.php.
Ouvrez ce fichier dans un éditeur de texte. Faites défiler jusqu’à la ligne qui dit That’s all, stop editing! Happy publishing. (Si vous utilisez une ancienne version comme WordPress 5.0, il sera écrit Happy blogging à la place).
Ajoutez ces lignes juste avant :
define( 'WP_DEBUG', true);

define( 'WP_DEBUG_LOG', true);

define( 'WP_DEBUG_DISPLAY', false );
Analysons ce que fait chacun d’eux :
- WP_DEBUG : Cela active le mode de débogage de WordPress.
- WP_DEBUG_LOG : Cela enregistre toutes les erreurs dans un fichier debug.log dans votre répertoire wp-content.
- WP_DEBUG_DISPLAY : Cela empêche l’affichage des erreurs sur le front-end de votre site.
Enregistrez vos modifications et téléchargez le fichier sur votre serveur.
WordPress enregistrera désormais toutes les erreurs, avertissements et notifications dans le fichier debug.log. Vous pouvez accéder à ce fichier pour voir ce qui se passe sous le capot de votre site.
Méthode 3. Utiliser Script Debug
Le problème que vous essayez de résoudre n’est peut-être pas dans votre code PHP, mais dans vos scripts WordPress. C’est là que SCRIPT_DEBUG s’avère utile.
Script Debug est une constante qui force WordPress à utiliser les versions complètes des fichiers CSS et JavaScript principaux au lieu des versions minifiées utilisées par défaut. C’est particulièrement utile pour les développeurs de thèmes et de plugins, ou lorsque vous traitez des problèmes de JavaScript et de CSS.
Tout comme dans la méthode précédente, vous devrez accéder à votre fichier wp-config.php.
Ajoutez cette ligne :
define( 'SCRIPT_DEBUG', true );Ensuite, enregistrez et téléchargez à nouveau le fichier.
En cas d'erreur, vous obtiendrez un numéro de ligne plus précis et un message d'erreur plus clair. C'est parce que les scripts non minifiés sont plus faciles à lire et à déboguer. Vous pouvez parcourir le code ligne par ligne, ce qui permet de trouver facilement où un problème pourrait survenir.
Gardez à l'esprit que les scripts non minifiés peuvent ralentir votre site, n'utilisez donc SCRIPT_DEBUG que lorsque vous déboguez activement. Désactivez-le toujours sur un site en production une fois que vous avez terminé.
Méthode 4. Activer la journalisation des requêtes de base de données
Parfois, le coupable des erreurs WordPress se trouve dans vos requêtes de base de données. Des interactions de base de données lentes ou problématiques peuvent avoir un impact significatif sur les performances de votre site.
C'est là que la journalisation des requêtes de base de données s'avère utile. Vous pouvez utiliser la constante SAVEQUERIES pour enregistrer des informations sur toutes les requêtes de base de données exécutées sur votre page. Cela inclut :
- La requête SQL elle-même
- Le temps d'exécution de la requête
- Les fonctions qui ont appelé la requête
Pour activer la constante SAVEQUERIES, ajoutez cette ligne à votre fichier wp-config.php :
define( 'SAVEQUERIES', true );Contrairement aux autres méthodes de débogage, SAVEQUERIES n'affiche pas automatiquement ses résultats. Vous devrez ajouter du code à votre thème pour voir les données.
Ajoutez ce code au fichier footer.php de votre thème (n'oubliez pas de le supprimer une fois le débogage terminé) :
<?php

if ( current_user_can( 'administrator' ) ) {

 global $wpdb;

 echo "<pre>";

 print_r( $wpdb->queries );

 echo "</pre>";

}

?>
Cela affichera les informations de requête en bas de vos pages.
Méthode 5. Vérifier les erreurs PHP
En activant le rapport d'erreurs PHP, vous pouvez intercepter les erreurs qui pourraient ne pas être visibles via les outils de débogage intégrés de WordPress.
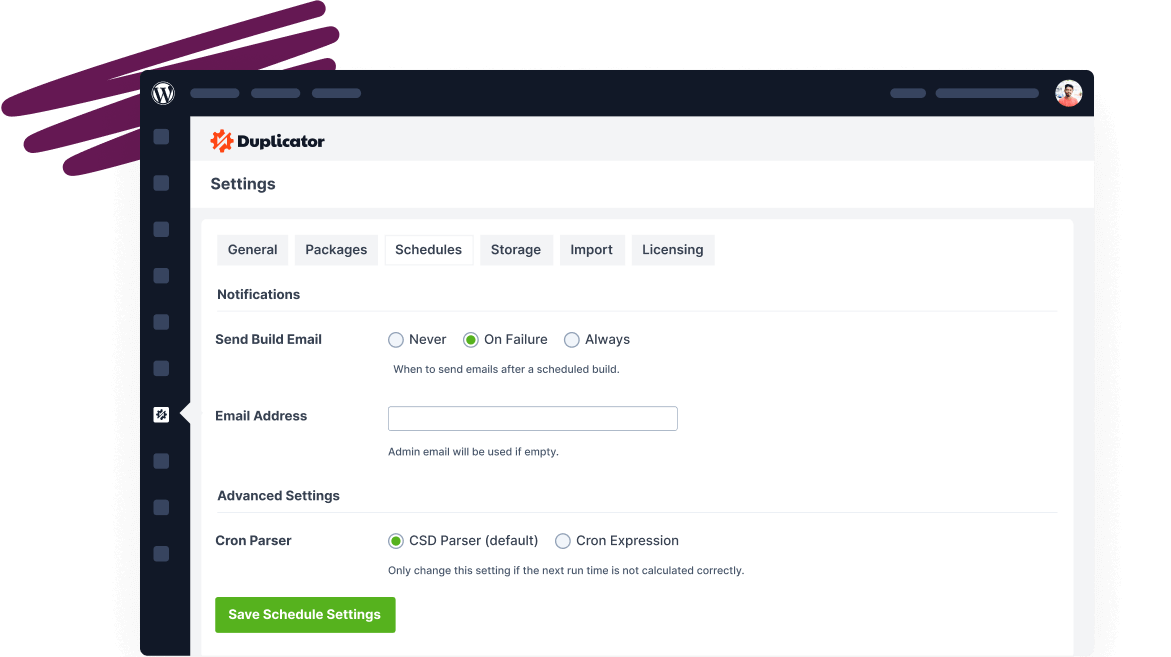
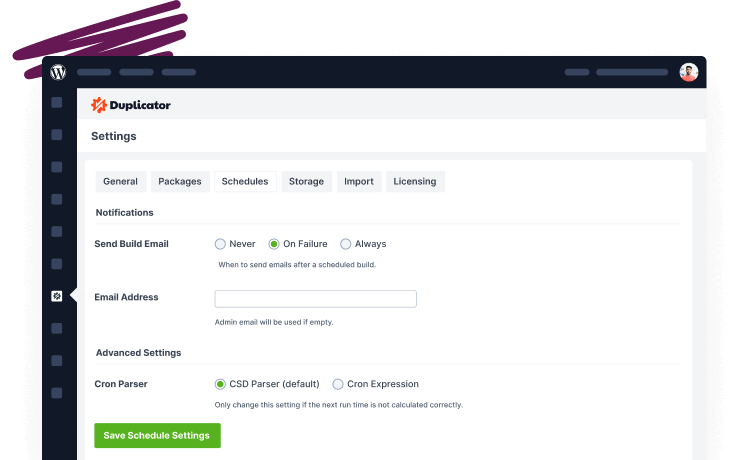
Tout d'abord, vous devrez trouver votre fichier php.ini. Vous pouvez le faire avec Duplicator ! Allez dans Duplicator Pro » Outils. Vous trouverez le chemin d'accès au fichier php.ini dans les paramètres Informations serveur.

Vous pouvez également créer un nouveau fichier dans le répertoire racine de votre WordPress et le nommer phpinfo.php. Ajoutez-y ce code :
<?php phpinfo(); ?>Accédez à ce fichier via votre navigateur avec un lien tel que votredomaine.com/phpinfo.php. Cela vous montrera votre configuration PHP.
Dans la sortie phpinfo, recherchez l'entrée Fichier de configuration chargé. Cela vous indique où se trouve votre fichier php.ini.
Ouvrez votre fichier php.ini et recherchez le code suivant :
error_reporting = E_ALL

display_errors = On
S'ils ne sont pas là, ajoutez-les. S'ils sont là mais définis sur des valeurs différentes, modifiez-les pour qu'ils correspondent au code ci-dessus.
Si vous n'avez pas accès à php.ini, vous pouvez ajouter ces lignes à votre fichier .htaccess :
php_value error_reporting E_ALL

php_flag display_errors on
Ou, ajoutez ceci en haut de votre fichier wp-config.php :
ini_set('display_errors', 1);

ini_set('display_startup_errors', 1);

ini_set('error_reporting',E_ALL);Méthode 6. Vérifier doing_it_wrong()
WordPress dispose d'une fonction unique appelée _doing_it_wrong() qui peut être incroyablement utile pour les développeurs et les propriétaires de sites. Cette fonction est la façon dont WordPress vous indique que vous n'utilisez pas quelque chose correctement.
Tout d'abord, assurez-vous que WP_DEBUG est activé dans votre fichier wp-config.php.
Avec le débogage activé, WordPress vous affichera désormais des messages lorsqu'il détectera une utilisation incorrecte des fonctions ou des API.
Ces messages ressemblent généralement à ceci :
Warning: {function_name}() was called incorrectly. {message} in {file} on line {line_number}La fonction doing_it_wrong() fournit des informations précieuses telles que :
- Le nom de la fonction utilisée incorrectement
- Un message expliquant ce qui ne va pas
- Le fichier et le numéro de ligne où le problème se produit
Si cela concerne un plugin ou un thème que vous avez développé, mettez à jour votre code pour utiliser la méthode correcte. S'il s'agit d'un plugin ou d'un thème tiers, signalez le problème au développeur.
Tous les messages doing_it_wrong() n'indiquent pas des erreurs critiques, mais ils méritent tous d'être traités. Testez toujours minutieusement après avoir effectué des modifications basées sur ces messages.
Nos astuces d'experts pour le débogage WordPress
Plongeons dans quelques stratégies de débogage de niveau professionnel. Ces astuces vous aideront à devenir un dépanneur plus efficace et performant, vous faisant gagner du temps et vous évitant des maux de tête à long terme.
- Consultez les fichiers journaux d'erreurs : Vérifiez wp-content/debug.log pour les erreurs et avertissements PHP horodatés ; effacez le journal avant de reproduire un problème pour filtrer le bruit
- Utilisez un site de staging : Déboguez sur une copie exacte de votre site en direct dans un environnement privé afin de pouvoir expérimenter librement sans risquer d'interruption de service
- Vérifiez la configuration du serveur : Vérifiez vos règles .htaccess, votre version de PHP et les paramètres du serveur comme sources d'erreurs que le mode de débogage WordPress ne détectera pas directement
- Trouvez les outils de développement : Utilisez Chrome DevTools ou Firefox Developer Tools pour inspecter le HTML, le CSS, le JavaScript et les requêtes réseau directement dans le navigateur
- Utilisez WP-CLI : Exécutez des outils en ligne de commande comme
wp db checketwp plugin statuspour diagnostiquer les problèmes plus rapidement qu'en naviguant dans le tableau de bord d'administration - N'activez le débogage que temporairement : Le mode de débogage peut exposer des données sensibles et ralentir votre site ; désactivez-le dès que vous avez terminé le dépannage
- N'utilisez pas trop de plugins de débogage : Plusieurs plugins peuvent entrer en conflit les uns avec les autres ; tenez-vous-en à un seul outil bien noté qui répond à vos besoins spécifiques
- Utilisez un thème enfant : Effectuez les personnalisations du thème dans un thème enfant afin que les mises à jour du thème parent n'écrasent pas vos modifications ou ne compliquent pas le débogage
- Implémentez le contrôle de version : Suivez toutes les modifications de fichiers avec Git afin de pouvoir identifier exactement quelle modification a introduit un bug et de revenir en arrière proprement
- Maintenez WordPress à jour : L'utilisation des versions actuelles de WordPress, des thèmes et des plugins élimine de nombreux bugs connus avant qu'ils n'affectent votre site
- Collaborez et demandez de l'aide : Utilisez WordPress Stack Exchange, les forums de support des plugins et la communauté des développeurs lorsque vous êtes bloqué par vous-même
1. Consultez les fichiers journaux d'erreurs
WordPress enregistre généralement les journaux d’erreurs dans le répertoire wp-content. Recherchez un fichier nommé debug.log. Si vous ne le trouvez pas, vous devrez peut-être le créer manuellement ou vérifier auprès de votre fournisseur d’hébergement pour connaître l’emplacement correct.
Chaque entrée dans le journal suit généralement ce format :
[Date and Time] PHP Error level: Error message in /path/to/file.php on line XLors de l’examen des journaux, faites attention à :
- Erreurs récurrentes : certains problèmes se produisent-ils de manière répétée ?
- Heure des erreurs : les problèmes surviennent-ils à des moments précis ou après certaines actions ?
- Gravité des erreurs : concentrez-vous d’abord sur les erreurs critiques et les avertissements.
2. Utiliser un site de staging
L’une des règles d’or du débogage WordPress est la suivante : ne jamais déboguer sur un site en production. C’est là qu’interviennent les sites de staging.
Un site de staging vous permet de déboguer et d’expérimenter sans le stress de casser votre site en production. C’est une copie exacte de votre site Web qui se trouve dans une zone de test privée et sécurisée.
Que vous résolviez un bug délicat ou que vous testiez une refonte majeure du site, votre environnement de staging est l’endroit idéal pour le faire. C’est un investissement qui rapporte en termes de stabilité du site et de tranquillité d’esprit.
De nombreux fournisseurs d’hébergement proposent la création de sites de staging en un clic. Vous pouvez également configurer un environnement de développement local.
Voici quelques conseils que j’ai appris en utilisant des sites de staging :
- Synchronisez régulièrement votre site de staging avec votre site en production pour vous assurer que vous testez sur une version à jour.
- Peuplez votre site de staging avec le contenu réel de votre site en production pour des tests les plus précis.
- Protégez par mot de passe votre site de staging pour le tenir à l’écart des regards indiscrets et des moteurs de recherche.
- Utilisez votre site de staging pour tester les mises à jour, les nouveaux plugins et les modifications de thème avant de les appliquer à votre site en production.
- Tenez un journal de ce que vous avez modifié sur le site de staging, afin de pouvoir reproduire facilement les corrections réussies sur votre site en production.
3. Vérifier la configuration du serveur
Votre serveur est le moteur qui alimente votre site WordPress. Il a besoin des bons paramètres pour fonctionner correctement.
Le fichier .htaccess joue un rôle crucial dans la manière dont votre site interagit avec le serveur. Il peut contenir des règles pour des éléments tels que les permaliens (URL personnalisées) et les réécritures. Assurez-vous que votre fichier .htaccess est correctement configuré, surtout si vous avez récemment effectué des modifications.
WordPress a des exigences spécifiques en matière de version PHP. Vérifiez la version PHP de votre serveur et assurez-vous qu’elle répond à la version minimale recommandée pour votre installation WordPress actuelle. Les versions PHP obsolètes peuvent entraîner des problèmes de compatibilité et des vulnérabilités de sécurité.
Parfois, les erreurs peuvent provenir du serveur lui-même. Si les méthodes de débogage ne résolvent pas le problème, envisagez de contacter votre fournisseur d'hébergement pour obtenir de l'aide. Il pourra diagnostiquer les problèmes spécifiques au serveur qui pourraient affecter votre site.
4. Trouver les outils de développement
Votre navigateur Web est équipé d'un ensemble puissant d'outils de débogage. Apprendre à les utiliser efficacement peut considérablement améliorer vos compétences en débogage WordPress.
De nombreux développeurs utilisent des extensions de navigateur comme Chrome DevTools ou Firefox Developer Tools. Celles-ci vous aident à résoudre les problèmes du côté client de votre site.
Voici ce que vous pouvez faire avec ces outils :
- Inspecter le HTML, le CSS et le JavaScript depuis un navigateur Web
- Analyser les requêtes et réponses HTTP
- Modifier la structure HTML ou le style CSS
- Exécuter le code pas à pas
- Définir des points d'arrêt
- Identifier les ressources lentes
- Trouver les goulots d'étranglement de performance
- Et plus encore !
5. Utiliser WP_CLI
WP-CLI (WordPress Command Line Interface) offre un moyen puissant et efficace de déboguer votre site WordPress. C'est un outil qui vous permet d'interagir avec votre installation WordPress directement via des commandes.
Avec WP-CLI, vous rationaliserez votre flux de travail de dépannage. L'exécution de commandes peut être beaucoup plus rapide que la modification de fichiers ou l'utilisation du tableau de bord d'administration. Vous pouvez également automatiser des tâches répétitives ou créer des scripts personnalisés pour des besoins de débogage spécifiques.
Une fois installé, vous pouvez naviguer vers votre répertoire WordPress en utilisant la ligne de commande et exécuter des commandes WP-CLI. Ces commandes commencent généralement par wp suivi d'une action spécifique (par exemple, wp user list).
Voici quelques commandes de débogage utiles pour commencer :
- wp db check : Vérifie l'état de votre base de données WordPress.
- wp plugin status : Liste tous les plugins WordPress installés et leur état actuel (actif, inactif, etc.).
- wp theme status : Liste tous les thèmes installés et leur état actuel.
- wp debug log : Affiche le contenu du fichier journal de débogage WordPress.
Ce ne sont là que quelques exemples. La documentation officielle fournit une liste complète et des explications détaillées pour chaque commande.
N'oubliez pas que l'utilisation efficace de WP-CLI nécessite une certaine familiarité avec la ligne de commande. Cependant, son efficacité et sa puissance en font un outil précieux pour les utilisateurs expérimentés qui souhaitent accélérer leur processus de débogage.
6. Activer le débogage uniquement temporairement
Bien que WP Debug soit un outil puissant, il est important de se rappeler qu'il n'est pas destiné à une utilisation permanente.
Le mode de débogage peut potentiellement ralentir le temps de chargement des pages. En effet, il affiche des messages d'erreur détaillés et enregistre des informations qui ne sont pas nécessaires au fonctionnement normal.
Laisser le débogage activé sur un site en production expose des informations sensibles telles que les messages d’erreur et les requêtes de base de données. Ces informations pourraient être potentiellement exploitées par des pirates.
Il est donc important de n’activer le débogage que temporairement lorsque vous dépannez activement un problème. Voici quelques bonnes pratiques :
- Une fois que vous avez implémenté une correction, désactivez le débogage en supprimant l’extrait de code pertinent de votre fichier wp-config.php (pour le débogage manuel) ou en désactivant le plugin de débogage.
- Idéalement, utilisez un site de staging pour le débogage. Vous pouvez expérimenter librement avec les méthodes de débogage sans ralentir votre site en production.
- Établissez un flux de travail clair pour le débogage. Cela peut impliquer l’activation du débogage, l’analyse des journaux et des messages d’erreur, la résolution du problème, puis la désactivation du débogage.
En suivant ces directives, vous dépannerez sans compromettre les performances ou la sécurité de votre site.
7. N’utilisez pas trop de plugins de débogage
Les plugins de débogage offrent un moyen pratique d’activer le débogage dans WordPress. Cependant, il y a un inconvénient potentiel à en utiliser trop.
Chaque plugin ajoute du code et des ressources à votre site. Avoir plus d’un plugin de débogage en cours d’exécution simultanément peut ralentir les performances de votre site Web.
Différents plugins de débogage peuvent avoir des fonctionnalités qui se chevauchent. Cela peut entraîner des conflits et un comportement inattendu sur votre site.
Voici une approche plus stratégique pour utiliser les plugins de débogage :
- Identifiez vos besoins
Avant d’installer un plugin de débogage, définissez clairement le problème que vous essayez de résoudre. Recherchez des plugins qui répondent à ce besoin spécifique.
- Commencez avec un seul plugin
Installez un plugin de débogage bien noté, connu pour sa fiabilité et sa facilité d’utilisation. Parmi les options populaires, citons Query Monitor, Debug Bar et WP Debugging.
- Désactivez les fonctionnalités inutilisées
De nombreux plugins de débogage offrent une gamme de fonctionnalités. Désactivez ceux que vous n’utilisez pas actuellement pour minimiser la consommation de ressources.
8. Utilisez un thème enfant
Les thèmes enfants offrent un moyen sûr et efficace de modifier les fonctionnalités et l’apparence de votre thème sans modifier directement les fichiers du thème. Ceci est particulièrement utile pour déboguer les problèmes liés au thème.
Comme vous apportez des modifications dans le thème enfant, les fichiers du thème d’origine restent intacts. Les nouvelles mises à jour du thème n’écraseront pas vos personnalisations.
Si vous rencontrez un problème lié au code de votre thème, vous pouvez concentrer vos efforts de débogage sur les fichiers du thème enfant. Cela simplifie le dépannage en isolant la source potentielle du problème.
L’utilisation d’un thème enfant vous permet de maintenir une base de code distincte pour vos personnalisations. Cela facilite le suivi des modifications, le retour aux versions précédentes si nécessaire et la collaboration avec d’autres développeurs.
9. Implémentez le contrôle de version
Vous avez apporté des modifications importantes à votre site WordPress, pour finalement rencontrer un problème critique plus tard. Ne serait-il pas utile de remonter le temps et de revenir à une version précédente ?
Le contrôle de version vous permet de suivre toutes les modifications apportées aux fichiers de votre site WordPress au fil du temps. Cela crée un historique des révisions de votre site.
Si vous rencontrez des problèmes après des modifications de code, vous pouvez facilement revenir à une version stable précédente. Cela peut vous sauver la vie si quelque chose tourne mal pendant le développement ou le débogage.
En analysant les modifications apportées entre les différentes versions, vous pouvez identifier la modification exacte qui a pu introduire un bug. Vous rationaliserez considérablement le processus de débogage.
Git est largement utilisé pour le contrôle de version de WordPress. Je vous recommande de commencer par ici si vous souhaitez gérer les modifications de votre code.
10. Gardez WordPress à jour
Déboguer un problème sur un site WordPress obsolète peut être comme chasser une cible mouvante. Les mises à jour régulières garantissent que vous travaillez avec la dernière version stable, rendant le débogage plus efficace et fiable.
En suivant une routine de mise à jour cohérente, vous pouvez maintenir un site Web WordPress sécurisé, stable et fonctionnel. Vous êtes moins susceptible de rencontrer des problèmes nécessitant un débogage approfondi, ce qui vous fera gagner du temps à long terme.
11. Collaborez et demandez de l'aide
Même les développeurs WordPress expérimentés sont confrontés à des défis qui nécessitent un soutien supplémentaire. Vous ne devriez jamais avoir peur de poser des questions et d'apprendre des autres dans votre domaine.
De nombreux forums en ligne sont dédiés au dépannage de WordPress. Vous pouvez décrire votre problème de débogage, partager des messages d'erreur et obtenir des informations précieuses d'autres utilisateurs et développeurs.
Le Stack Exchange de WordPress est une mine d'or pour les requêtes liées à WordPress. Recherchez des solutions existantes à votre problème ou posez une question détaillée pour obtenir l'aide de la communauté.
Vous pouvez également trouver un support dédié pour les thèmes et les plugins sur WordPress.org. Si vous rencontrez un problème avec un plugin ou un thème spécifique, publiez dans le forum de support pour obtenir des conseils de dépannage.
Si vous êtes propriétaire d'un site Web avec une expérience technique limitée, envisagez d'engager un développeur WordPress professionnel. Il pourra analyser votre problème, identifier la cause profonde et mettre en œuvre une solution, vous faisant gagner un temps et des efforts précieux.
FAQ sur le débogage WordPress
Comment corriger les erreurs de débogage dans WordPress ?
Les étapes spécifiques pour corriger les erreurs de débogage dépendent de la nature du problème. Cependant, le processus général implique l'activation du mode de débogage WP, l'analyse des journaux et des messages d'erreur, la mise en œuvre d'une correction, puis la désactivation du débogage.
Que fait réellement le débogage ?
Le débogage est le processus d'identification et de résolution des problèmes sur votre site WordPress. Il implique l'activation du mode de débogage, la lecture des journaux d'erreurs et le traçage de la cause profonde des dysfonctionnements. En corrigeant ces problèmes, vous pouvez garantir que votre site WordPress fonctionne à son plus haut niveau.
Le débogage doit-il être activé ou désactivé ?
Le mode de débogage ne doit être activé que temporairement lorsque vous dépannez activement un problème. Le laisser activé peut nuire aux performances, exposer des informations sensibles et encombrer votre tableau de bord d'administration avec des messages inutiles. Une fois le problème résolu, désactivez le débogage pour maintenir un site Web sécurisé et performant.
Comment savoir si WP debug est activé ?
Vérifiez wp-config.php : recherchez des extraits de code tels que define('WP_DEBUG', true) ou define('WP_DEBUG_LOG', true) dans votre fichier wp-config.php. Ces lignes vous indiquent que le débogage est activé.
Gardez votre site WordPress propre et sans erreurs
Au lieu d'attendre que quelque chose se casse, intégrez des vérifications régulières dans votre flux de travail. Examinez vos journaux d'erreurs, maintenez vos logiciels à jour et testez les modifications sur un site de staging avant qu'elles n'atteignent la production.
Un processus de débogage propre dépend également d'une solution de repli. Avant de toucher à wp-config.php, de modifier les fichiers de thème ou de commencer à désactiver des plugins, effectuez une sauvegarde. Avec Duplicator Pro, c'est une opération en un clic, et si quelque chose tourne mal pendant le dépannage, vous pouvez restaurer l'ensemble du site aussi rapidement.
Le débogage est beaucoup moins stressant lorsque vous savez que vous pouvez annuler n'importe quoi. Passez à Duplicator Pro pour des restaurations en un clic et une récupération de sinistre facile !
Et ne sous-estimez pas à quel point le débogage devient plus facile avec la répétition. La première fois que vous parcourez un fichier debug.log, cela semble écrasant. La dixième fois, vous saurez exactement où chercher. Prenez l'habitude, utilisez les bons outils, et les problèmes qui prenaient des heures commenceront à prendre des minutes.
Pendant que vous êtes ici, je pense que vous aimerez ces guides WordPress supplémentaires :
- Comment nettoyer un site WordPress
- Votre site WordPress pourrait disparaître demain (sauf si vous faites ceci)
- Comment corriger l'écran blanc de la mort de WordPress
- Comment corriger l'erreur 500 du serveur interne
- Comment corriger les erreurs de contenu mixte dans WordPress
- Comment réparer un site WordPress lent après une migration