![[NEU] Duplicator DB Optimizer: Bereinigen Sie Ihre WordPress-Datenbank, bevor sie zu einem Problem wird](https://duplicator.com/wp-content/uploads/2026/06/Announcement-DB-Optimizer.jpg)

WordPress-Debugging-Tools, die Fehler in Minuten (nicht Stunden) finden
 Joella Dunn
Joella Dunn
Joella Dunn
 John Turner
John Turner
John Turner
Haben Sie jemals auf einen Fehler auf Ihrer WordPress-Website gestarrt und sich völlig hilflos gefühlt? Ich war schon da.
Ich kann nicht zählen, wie oft ich auf mysteriöse Probleme gestoßen bin, die scheinbar unmöglich zu verfolgen waren – bis ich die richtigen Debugging-Tools entdeckte.
Die Sache ist die mit WordPress-Websites: Sie sind komplexe Systeme mit vielen beweglichen Teilen. Themes, Plugins und WordPress-Kern-Dateien müssen alle perfekt zusammenarbeiten. Wenn etwas schiefgeht, kann es unmöglich erscheinen, den Schuldigen zu finden.
Aber das muss nicht so sein.
Mit den richtigen WordPress-Debugging-Tools können Sie Probleme schnell identifizieren und beheben, die sonst Stunden zum Aufspüren benötigen würden.
Ob Sie mit Plugin-Konflikten, Leistungsproblemen oder mysteriösen PHP-Fehlern zu kämpfen haben, das richtige Toolkit macht den Unterschied.
In diesem Leitfaden führe ich Sie durch die effektivsten WordPress-Debugging-Tools, die ich persönlich getestet und auf die ich mich verlassen habe. Fangen wir an!
Inhaltsverzeichnis
Welche Probleme können Sie mit WordPress-Debugging-Tools lösen?
Bevor wir uns mit spezifischen Tools befassen, sprechen wir über die realen Probleme, die Sie angehen können.
Das Verständnis dieser häufigen Probleme hilft Ihnen zu wissen, wann und wie Sie Ihr Debugging-Toolkit einsetzen müssen.
Der White Screen of Death
Diese Momente, in denen Ihre Website plötzlich nichts als einen leeren weißen Bildschirm anzeigt, können Panik auslösen.
Debugging-Tools können dieses Problem auf seine Quelle zurückführen, die oft ein PHP-Fehler oder ein Speicherlimitproblem ist. Anstatt zu raten, was schief gelaufen ist, können Sie genaue Fehlermeldungen und Stack-Traces erhalten, die auf den problematischen Code hinweisen.
Mysteriöse Leistungsprobleme
Ihre Website scheint langsam zu sein, aber Sie können nicht herausfinden, warum.
Debugging-Tools können versteckte Engpässe aufdecken. Sie zeigen Ihnen, wie lange jedes Seitenelement zum Laden benötigt, welche Datenbankabfragen langsam laufen und welche Plugins übermäßige Ressourcen verbrauchen.
Plugin- und Theme-Konflikte
Eines der frustrierendsten WordPress-Probleme ist, wenn Plugins oder Themes Softwarekonflikte haben.
Es kann schwierig und zeitaufwendig sein, das Problem durch Versuch und Irrtum zu lösen. Debugging-Tools zeigen Ihnen genau, welche Komponenten in Konflikt stehen, welche Fehler sie generieren und wo im Code diese Konflikte auftreten.
Datenbankabfragen gehen schief
Haben Sie sich jemals gefragt, warum einige Seiten sofort laden, während andere ewig dauern? Oft liegt es an ineffizienten Datenbankabfragen.
Debugging-Tools können Ihnen jede Abfrage anzeigen, die auf Ihrer Seite ausgeführt wird, wie lange jede Ausführung dauert und welche Abfragen redundant oder schlecht optimiert sind.
PHP-Fehler und Warnungen
Viele WordPress-Probleme entstehen aus PHP-Problemen, die für normale Benutzer verborgen sind. Diese können von einfachen Hinweisen bis zu fatalen Fehlern reichen, die Ihre Website zum Absturz bringen.
Mit den richtigen Debugging-Tools können Sie:
- Alle PHP-Fehler in Echtzeit sehen
- Verstehen, welcher Code den Fehler ausgelöst hat
- Veraltete Funktionsverwendungen aufspüren, bevor sie zu einem Problem werden
Beste WordPress-Debugging-Tools
Wenn es um das Debugging von WordPress geht, kann kein einzelnes Tool alles erledigen. Deshalb pflegen professionelle Entwickler ein Toolkit von Debugging-Lösungen.
Lassen Sie uns die effektivsten verfügbaren Tools untersuchen, beginnend mit den integrierten Debugging-Funktionen von WordPress.
Integriertes WordPress-Debugging
WordPress verfügt über leistungsstarke Debugging-Funktionen, von denen viele Benutzer nicht einmal wissen, dass sie existieren. Wir haben diese ausgiebig auf Dutzenden von Websites getestet und sie für die anfängliche Problemdiagnose als unschätzbar wertvoll erachtet.
Das integrierte Debugging-System funktioniert, indem spezifische Konstanten zu Ihrer wp-config.php-Datei hinzugefügt werden. Wenn es aktiviert ist, zeigt es Fehler, Warnungen und Hinweise an, die normalerweise verborgen sind.
Um den WordPress-Debug-Modus zu aktivieren, müssen Sie diese Zeilen zu Ihrer wp-config.php-Datei hinzufügen:
define( 'WP_DEBUG', true );
define( 'WP_DEBUG_LOG', true );
define( 'WP_DEBUG_DISPLAY', false );
Hier ist, was uns während unserer Tests am meisten beeindruckt hat:
Die integrierte WordPress-Debug-Protokollfunktion erstellt eine detaillierte Aufzeichnung aller Fehler, wodurch Probleme nachverfolgt werden können. Wir fanden dies besonders nützlich bei Hosting-Umgebungen, in denen Fehler nicht direkt auf dem Bildschirm angezeigt werden.
Ein bemerkenswerter Nachteil, auf den wir gestoßen sind, war, dass die Debug-Ausgabe für Anfänger überwältigend sein kann. Sie kann Hinweise anzeigen, die tatsächlich keine Probleme verursachen, was es schwieriger macht, echte Probleme zu identifizieren.
Vorteile:
- Kostenlos und bereits in WordPress enthalten
- Keine Leistungseinbußen bei Deaktivierung
- Erstellt detaillierte Protokolle für eine gründliche Untersuchung
- Fängt PHP-Fehler ab, die andere Tools möglicherweise übersehen
Nachteile:
- Erfordert manuelle Bearbeitung von wp-config.php
- Kann bei zu vielen Hinweisen überwältigend sein
- Keine visuelle Oberfläche zur Überprüfung von Fehlern
- Muss in der Produktion deaktiviert werden
Warum wir uns für das integrierte WordPress-Debugging entschieden haben:
Das native Debugging von WordPress bietet die Grundlage für alle anderen Debugging-Tools. Es ist oft mein erster Schritt bei der Fehlerdiagnose, da es keine zusätzlichen Plugins erfordert und Probleme auf der tiefsten Ebene der WordPress-Operationen erkennen kann.
Query Monitor

Query Monitor wurde zu unserer Top-Wahl für WordPress-Debugging-Plugins. Dieses kostenlose Tool bietet tiefe Einblicke in die Abläufe Ihrer Website. Außerdem verfügt es über eine einfach zu bedienende Oberfläche, die selbst neuere Entwickler navigieren können.
Was das Query Monitor-Plugin auszeichnet, ist seine umfassende Analyse von Datenbankabfragen. Die Möglichkeit, Abfragen nach Ausführungszeit, aufrufender Funktion oder Komponente zu sortieren, erleichtert die genaue Bestimmung, wo Optimierungen erforderlich sind.

Ich schätzte besonders, wie Query Monitor die Seitenladezeit nach Komponente aufschlüsselt. Es kann Ihnen zeigen, wie sich bestimmte Teile Ihrer Website auf das Benutzererlebnis auswirken.
Vorteile:
- Extrem detaillierte Leistungsanalyse
- Echtzeitüberwachung von Datenbankabfragen
- Zeigt HTTP-API-Anfragen und -Antworten an
- Verfolgt PHP-Fehler und Warnungen mit Kontext
Nachteile:
- Kann für Anfänger überwältigend sein
- Erfordert technisches Wissen zur Interpretation der Ergebnisse
- Leichte Leistungseinbußen bei Aktivierung
Warum wir Query Monitor gewählt haben:
Query Monitor ist eines der besten kostenlosen WordPress-Debugging-Tools. Es ist wertvoll für die Fehlersuche bei Leistungsproblemen und Datenbankproblemen.
Chrome DevTools

Obwohl nicht WordPress-spezifisch, sind Chrome DevTools eine großartige Ergänzung für Debugging-Workflows. Ihr Netzwerk-Panel und Performance-Profiler können Ihnen Einblicke geben, die WordPress-Plugins nicht bieten können.
Wenn Sie einen Chrome-Browser verwenden, können Sie mit der rechten Maustaste auf ein Element Ihrer Website klicken und es untersuchen. Chrome DevTools wird automatisch geöffnet und gibt Ihnen schnellen Zugriff auf den HTML-Code Ihrer Website.

Mit Chrome DevTools können Sie die Leistung Ihrer Website überwachen, JavaScript debuggen, CSS-Verbesserungen identifizieren und vieles mehr.
Vorteile:
- Leistungsstarke Front-End-Debugging-Funktionen
- Im Chrome-Browser integriert
- Umfangreiche Dokumentation verfügbar
- Regelmäßige Updates und Verbesserungen
- Erweiterte Performance-Analyse-Tools
Nachteile:
- Lernkurve für erweiterte Funktionen
- Begrenzte Back-End-Sichtbarkeit
- Browser-spezifisches Tool
- Nicht WordPress-spezifisch
- Kann keine PHP- oder Datenbankinformationen abrufen
- Einige Funktionen erfordern Entwicklungsexpertise
Warum wir Chrome DevTools gewählt haben:
Seine leistungsstarken Front-End-Debugging-Funktionen machen es zu einer unverzichtbaren Ergänzung zu WordPress-spezifischen Tools. Die Möglichkeit, JavaScript zu debuggen und Netzwerkanfragen detailliert zu analysieren, schließt entscheidende Lücken in den WordPress-Debugging-Tools.
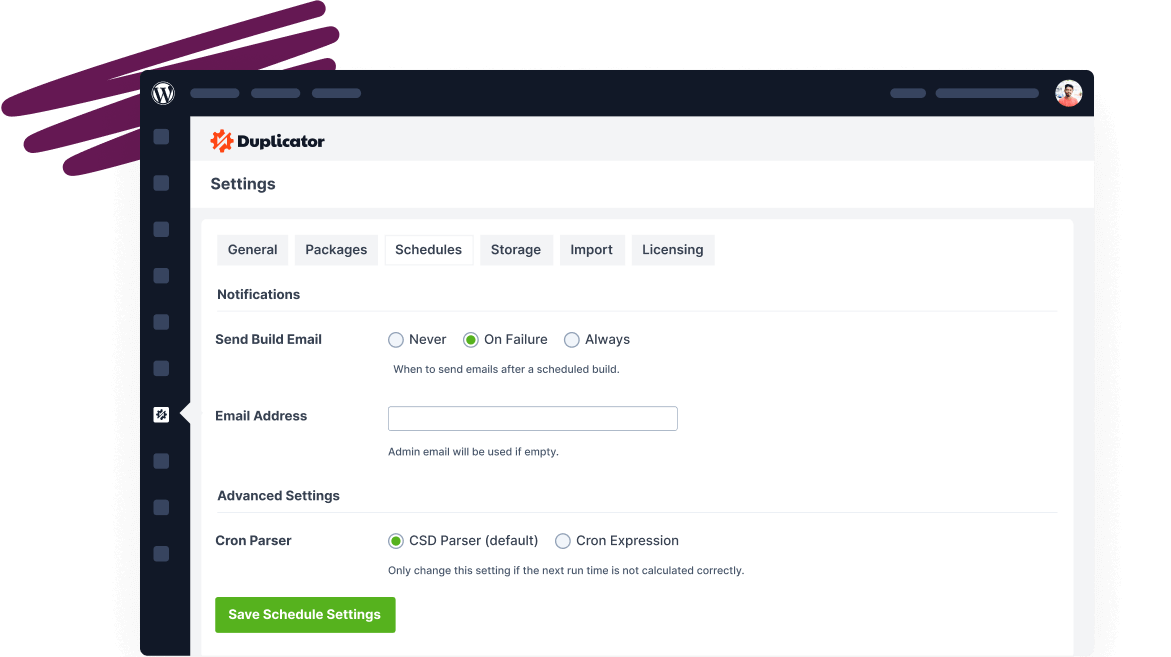
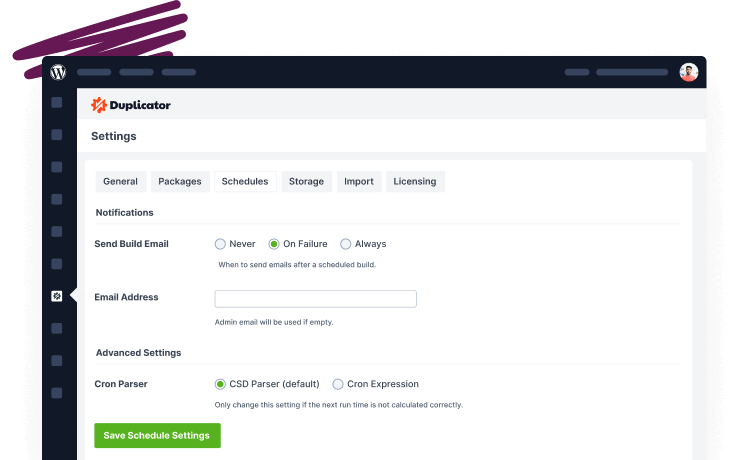
Duplikator

Duplicator ist hauptsächlich für seine Backup- und Migrationsfunktionen bekannt, aber wussten Sie, dass es auch ein wertvolles Werkzeug zum Debuggen ist?
Bevor Sie beim Debuggen Änderungen vornehmen, ist es entscheidend, ein aktuelles Backup zu haben. Duplicator kann ein vollständiges Backup Ihrer Website erstellen, einschließlich Dateien und Datenbank, um sicherzustellen, dass Sie vorbereitet sind, falls etwas schief geht.

Das Debuggen auf einer Live-Website kann riskant sein. Duplicator ermöglicht es Ihnen, schnell eine Staging-Umgebung zu erstellen. Diese Staging-Website spiegelt Ihre Produktions-Website und bietet Ihnen einen Ort, um Probleme sicher zu testen und zu debuggen.
Anstatt ein genaues Problem zu identifizieren, könnten Sie einfach ein Backup wiederherstellen. Duplicator ermöglicht es Ihnen, Ihre Website mit einem Klick wiederherzustellen und sofort schwerwiegende Fehler rückgängig zu machen.

Außerdem gibt es eine Notfallwiederherstellung, falls Ihre Website komplett offline ist.

Vorteile:
- Anpassbare Website-Backups
- Drag-and-Drop-Migrationen zu Staging-Umgebungen
- Ein-Klick-Wiederherstellungen
- Notfallwiederherstellung
- Cloud-Speicher für Backups
Nachteile:
- Hauptsächlich ein Backup- und Migrationstool
- Kein dediziertes Debugging-Plugin
Warum wir Duplicator gewählt haben:
Duplicator bietet Ihnen mit Backups ein Sicherheitsnetz und macht Staging-Umgebungen leicht zugänglich. Seine Wiederherstellungsfunktion macht es zu einem wesentlichen Bestandteil jedes Debugging-Toolkits.
WP-Debugging

Wenn Sie mit dem Debuggen in WordPress beginnen möchten, aber ein absoluter Anfänger sind, sollten Sie WP Debugging installieren. Dieses Plugin aktiviert den integrierten WordPress-Debugging-Modus für Sie.
Wenn Sie mit dem Debuggen fertig sind, deaktivieren Sie WP Debugging. Es entfernt automatisch Debug-Konstanten aus Ihren Website-Dateien.
Wenn Sie jedoch damit einverstanden sind, Ihre wp-config.php-Datei zu bearbeiten, überspringen Sie dieses Plugin. Es bietet keine zusätzliche Funktionalität über die Aktivierung des Debugging und die leichte Konfiguration der Fehleranzeige hinaus.
Vorteile:
- Benutzerfreundliche Oberfläche
- Sicher für Produktionsumgebungen
- Konfigurierbare Protokollierungsoptionen
- Keine Codebearbeitung erforderlich
- Schneller Einrichtungsprozess
Nachteile:
- Weniger detailliert als Query Monitor
- Begrenzte erweiterte Funktionen
Warum wir WP Debugging gewählt haben:
Seine Einfachheit macht es perfekt für Benutzer, die schnellen Zugriff auf die WordPress-Debugging-Funktionen benötigen, ohne Konfigurationsdateien zu bearbeiten.
WPCode

WPCode ermöglicht es Ihnen, benutzerdefinierte Code-Snippets direkt in Ihre WordPress-Website einzufügen, ohne die functions.php-Datei Ihres Themes bearbeiten zu müssen.
Mit WPCode können Sie die Code-Snippets Ihrer Website einfach hinzufügen und verwalten. Es verfügt über eine Fehlerverfolgung, sodass Sie sofort über Probleme in Ihrem PHP-Code informiert werden.
WPCode deaktiviert fehlerhafte Snippets automatisch. Es hebt sogar die Codezeile hervor, die den Fehler verursacht hat, sodass Sie ihn leicht beheben können.

Vorteile:
- Vereinfacht das Hinzufügen und Verwalten von benutzerdefinierten Code-Snippets für das Debugging
- Keine manuelle Bearbeitung von Theme-Dateien erforderlich
- Einfaches Aktivieren/Deaktivieren von Code-Snippets.
- Benutzerfreundliche Oberfläche
Nachteile:
- Hauptsächlich ein Plugin zur Verwaltung von Code-Snippets
- Kein dediziertes Debugging-Plugin
Warum wir WPCode gewählt haben:
WPCode ist ein großartiges Plugin, das bei der Fehlersuche von benutzerdefiniertem Code hilft, ohne dass Theme-Dateien bearbeitet werden müssen. Die Fehlerprotokollierung macht es zu einer wertvollen Ergänzung Ihres Debugging-Arsenals.
Best Practices für WordPress-Debugging
Beginnen Sie niemals mit dem Debugging ohne ein aktuelles Backup Ihrer Website. Eine falsche Bewegung bei der Fehlerbehebung kann Ihre Probleme verschlimmern.
Ich empfehle die Verwendung von Duplicator Pro zum Erstellen automatischer Backups. Sie haben immer ein sauberes Backup, auf das Sie zurückgreifen können.

Legen Sie vor dem Debugging ein vollständiges Backup als Wiederherstellungspunkt fest. Selbst wenn Ihre Website defekt ist, möchten Sie keine weiteren Daten verlieren. Duplicator wird Ihre Website auf den Ausgangszustand zurücksetzen, wenn etwas schief geht.

Debuggen Sie niemals auf einer Live-Website. Richten Sie eine Staging-Umgebung ein, die Ihre Produktionswebsite widerspiegelt, in der Sie Probleme sicher testen und debuggen können.
Duplicator Pro macht diesen Prozess nahtlos, indem es Ihnen ermöglicht, mit nur wenigen Klicks einen exakten Klon Ihrer Website in einer Staging-Umgebung zu erstellen. Sie müssen lediglich ein Backup Ihrer Original-Website erstellen und dieses Backup in den Staging-Bereich hochladen.

Denken Sie daran, dass Debug-Protokolle sensible Informationen enthalten können. Teilen Sie niemals rohe Debug-Protokolle öffentlich, ohne sie zuerst überprüft und sensible Daten geschwärzt zu haben.
Behalten Sie Ihre Serverressourcen während des Debugging im Auge. Einige Debugging-Tools können ressourcenintensiv sein, daher müssen Sie möglicherweise andere nicht wesentliche Plugins während des Debugging-Prozesses vorübergehend deaktivieren.
Wenn Sie debuggen, dokumentieren Sie alles. Führen Sie detaillierte Notizen über:
- Welche Änderungen Sie während des Debugging vornehmen
- Welche Fehler Sie antreffen
- Welche Tools spezifische Probleme aufgedeckt haben
- Welche Lösungen funktioniert haben (und welche nicht)
Diese Dokumentation wird unschätzbar wertvoll, wenn ähnliche Probleme in der Zukunft auftreten.
Häufig gestellte Fragen (FAQs)
Wie debugge ich meine WordPress-Website?
Debuggen Sie WordPress, indem Sie den Debug-Modus in der Datei wp-config.php aktivieren. Fügen Sie die Zeile define('WP_DEBUG', true); hinzu, um ihn zu aktivieren. Überprüfen Sie Fehler im Debug-Protokoll (wp-content/debug.log). Prüfen Sie auf Plugin-Konflikte, indem Sie Plugins einzeln deaktivieren und mit einem Standard-Theme testen.
Wie öffne ich die Entwicklertools in WordPress?
Öffnen Sie Tools für die WordPress-Entwicklung, indem Sie F12 oder Strg + Umschalt + I (Windows) oder Cmd + Option + I (Mac) in Ihrem Webbrowser drücken. Dies öffnet die Entwicklertools des Browsers, wo Sie HTML zur Fehlersuche untersuchen können.
Wie sehe ich alle Fehler in WordPress?
Sehen Sie alle Fehler in WordPress, indem Sie das Debugging in der Datei wp-config.php aktivieren. Für die Anzeige von Fehlern auf dem Bildschirm verwenden Sie define('WP_DEBUG_DISPLAY', true);. Stellen Sie sicher, dass die Fehlerberichterstattung in der PHP-Konfiguration Ihres Servers aktiviert ist.
Wie führe ich eine Website im Debug-Modus aus?
Um den Debug-Modus in WordPress zu aktivieren, bearbeiten Sie die Datei wp-config.php und fügen Sie define('WP_DEBUG', true); hinzu. Konsultieren Sie für andere Plattformen deren spezifische Debug-Einstellungen. Der Debug-Modus hilft bei der Identifizierung von Fehlern und protokolliert diese zur Fehlerbehebung.
Was ist das beste WordPress-Debug-Plugin?
Das beste WordPress-Debug-Plugin ist Query Monitor. Es bietet detaillierte Einblicke in Datenbankabfragen, PHP-Fehler, Hooks und eingebundene Skripte. Es hilft Entwicklern, Leistungsprobleme und Konflikte zu identifizieren. Andere beliebte Optionen sind Debug Bar, WP Debugging, Debug This und Debug Log Manager.
Abschließende Gedanken
Effektives Debugging ist unerlässlich für die Wartung einer gesunden WordPress-Website, aber es muss nicht überwältigend sein. Mit den richtigen Werkzeugen und Ansätzen können Sie Probleme schnell identifizieren und beheben, bevor sie Ihre Benutzer beeinträchtigen.
Denken Sie daran, dass Debugging am effektivsten ist, wenn es proaktiv durchgeführt wird. Regelmäßige Website-Wartung und -Überwachung können potenzielle Probleme erkennen, bevor sie zu kritischen Problemen werden.
Während Sie hier sind, werden Ihnen wahrscheinlich auch diese anderen WordPress-Anleitungen gefallen:
- Umfassender Leitfaden zum Debugging in WordPress: Von den Grundlagen bis zu fortgeschrittenen Techniken
- So bereinigen Sie eine WordPress-Website
- 20 häufigste WordPress-Fehler (und einige schnelle Lösungen)
- Ist WordPress sicher? Die Wahrheit enthüllt
- Schreiben Sie intelligenter, nicht härter: Entwicklertools für jeden WordPress-Profi
Bereit, einen professionellen Debugging-Workflow zu implementieren? Probieren Sie Duplicator Pro noch heute aus und erleben Sie nahtlose Website-Backups und die Erstellung von Staging-Umgebungen für sichereres Debugging.