How to Debug WordPress: Find and Fix Errors Fast
 John Turner
 John Turner
Whether you’re a seasoned developer or a curious site owner, debugging is your secret weapon for a healthier, happier website.
In this guide, we’re diving into the world of WordPress debugging. Don’t worry, it’s not as scary as it sounds. I’ll walk you through what debugging is, why it matters, and how to do it effectively.
By the end of this post, you’ll have the know-how to spot and fix errors to keep your WordPress site running smoothly.
Here are the key takeaways:
- WP_DEBUG is WordPress’s built-in diagnostic mode. Enabling it surfaces errors, warnings, and notices that are hidden by default on a normal site
- There are 5 ways to enable debugging: a plugin, manual wp-config.php edits, SCRIPT_DEBUG for front-end files, database query logging, and PHP error reporting
- Debugging should only be enabled temporarily—and ideally on a staging site, never a live one—to avoid exposing sensitive info or hurting performance
- Backups are your safety net throughout the entire debugging process. Tools like Duplicator Pro make it easy to roll back instantly if a fix makes things worse
Table of Contents
What Is Debugging in WordPress?
Think of debugging as your website’s health check-up. It’s the process of finding and fixing problems in your WordPress site’s code.
These problems can range from minor hiccups to major headaches including:
- Syntax errors: When there’s a typo or mistake in the code
- Logic errors: When the code doesn’t do what you expect it to
- Compatibility issues: When different parts of your site don’t work together
- Performance bottlenecks: When something’s slowing your site down
But debugging isn’t just for when things go wrong. It’s also a powerful way to optimize your site, even when everything seems fine. Debugging can help you catch potential issues before they become real problems.
So, whether you’re trying to fix a broken plugin or just want to make your site run faster, debugging is your go-to strategy. It’s an essential skill for anyone who wants to maintain a healthy, high-performing WordPress site.
Why Is Debugging Important?
You might be wondering, “Do I really need to bother with debugging?” The short answer is yes, and I’ll explain why.
Keeps your site running smoothly
Regular debugging is like routine maintenance. It helps you catch small issues before they turn into big, expensive problems. By fixing minor glitches early, you keep your site running along nicely.
Boosts performance
Ever visited a slow website? Frustrating, right?
Debugging can help you identify what’s slowing your site down. Maybe it’s a bulky plugin or an inefficient database query. Once you know the culprit, you can fix it and give your site a speed boost.
Enhances security
Hackers love to exploit vulnerabilities in websites. Debugging can help you spot potential security weak spots. By fixing these, you’re essentially putting stronger locks on your site’s doors.
Improves user experience
A buggy site can drive visitors away very quickly. Regular debugging ensures your site works as it should, keeping your visitors happy and coming back for more.
Saves time (and headaches) in the long run
Sure, debugging takes some time upfront. But it’s nothing compared to the time you’ll spend dealing with a major site crash or trying to figure out why your latest update broke everything.
Makes updates easier
When your site is well-maintained through regular debugging, applying updates becomes much smoother. You’re less likely to run into compatibility issues or unexpected breaks.
What Is WP Debug?
WP_DEBUG is a built-in debug mode in WordPress. Think of it as flipping a switch that turns on your site’s diagnostic mode. When enabled, it helps you spot issues that might be hiding under the surface.
Here’s what WP_DEBUG can do:
- Uncover errors that might crash your site
- Catch potential issues before they cause problems
- Fix plugin conflicts
- Debug custom code
- Write better code by seeing errors as you develop
Remember, WP_DEBUG is just one tool in your debugging arsenal, but it’s a powerful one. Used wisely, it can give you helpful debugging information so that you can optimize your WordPress site.
How to Enable WordPress Debugging
There are several ways to enable debugging in WordPress, each with its own advantages. We’ll walk through these methods one by one, starting with the easiest and moving to more advanced techniques.
Here’s how to enable WordPress debugging:
- Method 1: Use a WordPress Debugging Plugin: The easiest option for beginners; plugins like WP Debugging enable debug mode with a checkbox, no file editing required
- Method 2: Manually Enable WordPress Debugging: Edit wp-config.php directly to turn on WP_DEBUG, log errors to a file with WP_DEBUG_LOG, and hide them from visitors with WP_DEBUG_DISPLAY
- Method 3: Use SCRIPT_DEBUG: Forces WordPress to load full unminified CSS and JavaScript files instead of compressed versions, making front-end errors much easier to trace
- Method 4: Enable Database Query Logging: Uses the SAVEQUERIES constant to record every database query, its execution time, and which function triggered it
- Method 5: Check For PHP Errors: Enables server-level PHP error reporting to catch low-level errors that WordPress’s debug tools may not surface on their own
- Method 6: Check For doing_it_wrong(): Activates WordPress’s built-in warnings for incorrect API and function usage, with the exact file and line number where the problem occurs
Method 1. Use a WordPress Debugging Plugin
If you’re new to debugging or prefer a user-friendly approach, WordPress debugging plugins are your best friend. They provide a simple, visual way to identify and troubleshoot issues without diving into code.
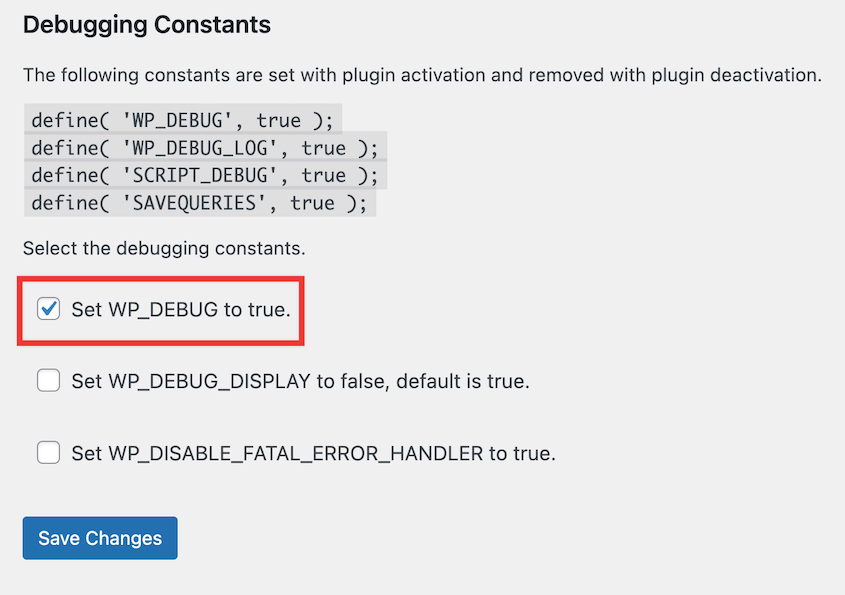
One simple plugin is WP Debugging. This will enable WP_Debug mode for you, so you don’t have to worry about file editing.
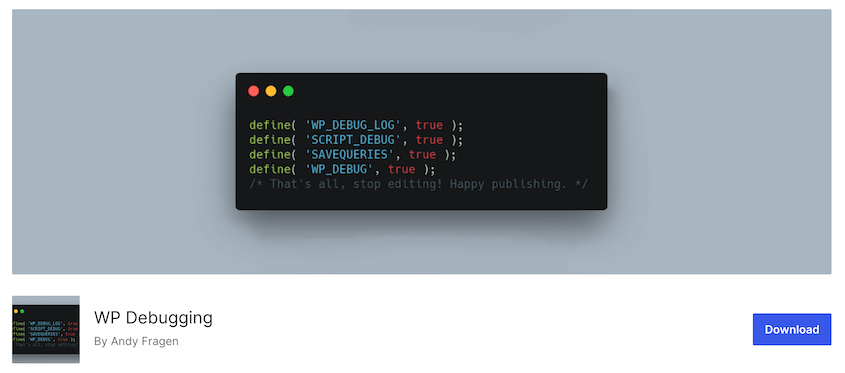
Once activated, go to Tools » WP Debugging. Check the box next to Set WP_DEBUG to true. Save your changes.
Then, you’ll see a new button at the top of your dashboard. Hover over Debug Quick Look and click on View File.
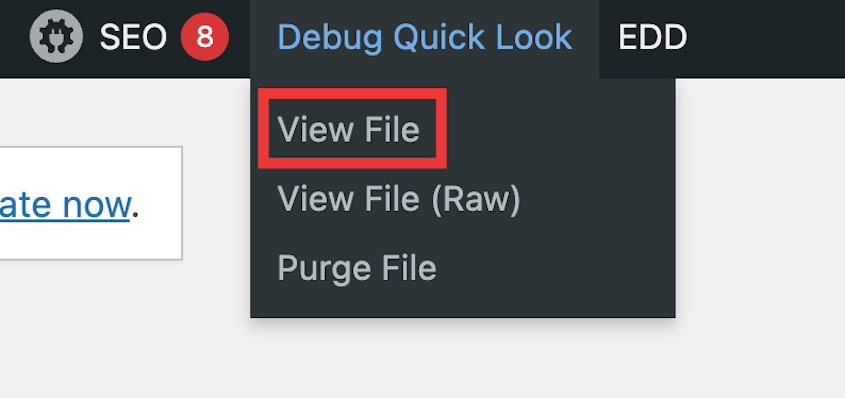
This opens the debugging log in a new window. You can check this for any errors and quickly fix them.
Debugging plugins offer a gentle introduction to the world of WordPress troubleshooting. They’re perfect for beginners or for quick checks on your site’s performance. As you get more comfortable with debugging, you might want to explore some of the more advanced methods we’ll cover next.
Method 2. Manually Enable WordPress Debugging
Ready to take your debugging skills up a notch? You can also manually enable debug mode. This method gives you more control and insight into what’s happening behind the scenes.
Now, you’ll need to access your files. You can do this through your hosting provider’s file manager (like cPanel) or an FTP client.
Once you connect your site, open the WordPress root directory (public_html). Find the wp-config.php file.
Open this file in a text editor. Scroll down to the line that says That’s all, stop editing! Happy publishing. (If you’re using an older version like WordPress 5.0, it’ll say Happy blogging instead).
Add these lines just before it:
define( 'WP_DEBUG', true);

define( 'WP_DEBUG_LOG', true);

define( 'WP_DEBUG_DISPLAY', false );
Let’s break down what each of these does:
- WP_DEBUG: This turns on WordPress debug mode.
- WP_DEBUG_LOG: This saves all errors to a debug.log file in your wp-content directory.
- WP_DEBUG_DISPLAY: This prevents errors from showing on your site’s front end.
Save your changes and upload the file back to your server.
WordPress will now log all errors, warnings, and notices to the debug.log file. You can access this file to see what’s going on under the hood of your site.
Method 3. Use Script Debug
The issue you’re trying to solve might not be in your PHP code, but in your WordPress scripts. That’s where SCRIPT_DEBUG comes in handy.
Script Debug is a constant that forces WordPress to use the full versions of core CSS and JavaScript files instead of the minified versions that are used by default. It’s particularly useful for theme and plugin developers, or when you’re dealing with JavaScript and CSS issues.
Just like in the previous method, you’ll need to access your wp-config.php file.
Add this line:
define( 'SCRIPT_DEBUG', true );Then, save and re-upload the file.
If there’s an error, you’ll get a more precise line number and clearer error message. This is because unminifed scripts are easier to read and debug. You can step through the code line by line, making it easy to find where a problem might be occurring.
Keep in mind that unminified scripts can slow down your site, so only use SCRIPT_DEBUG when you’re actively debugging. Always turn it off on a live site once you’re done.
Method 4. Enable Database Query Logging
Sometimes, the culprit behind WordPress errors is in your database queries. Slow or problematic database interactions can significantly impact your site’s performance.
That’s where database query logging comes in handy. You can use the SAVEQUERIES constant to save information about all database queries that run on your page. This includes:
- The SQL query itself
- How long the query took to execute
- Which functions called the query
To enable the SAVEQUERIES constant, add this line to your wp-config.php file:
define( 'SAVEQUERIES', true );Unlike other debugging methods, SAVEQUERIES doesn’t automatically display its results. You’ll need to add some code to your theme to see the data.
Add this code to your theme’s footer.php file (remember to remove it when you’re done debugging):
<?php

if ( current_user_can( 'administrator' ) ) {

 global $wpdb;

 echo "<pre>";

 print_r( $wpdb->queries );

 echo "</pre>";

}

?>
This will display the query information at the bottom of your pages.
Method 5. Check For PHP Errors
By enabling PHP error reporting, you can catch errors that might not be visible through WordPress’s built-in debugging tools.
First, you’ll need to find your php.ini file. You can do this with Duplicator! Go to Duplicator Pro » Tools. You’ll find the path to the php.ini file in the Server info settings.
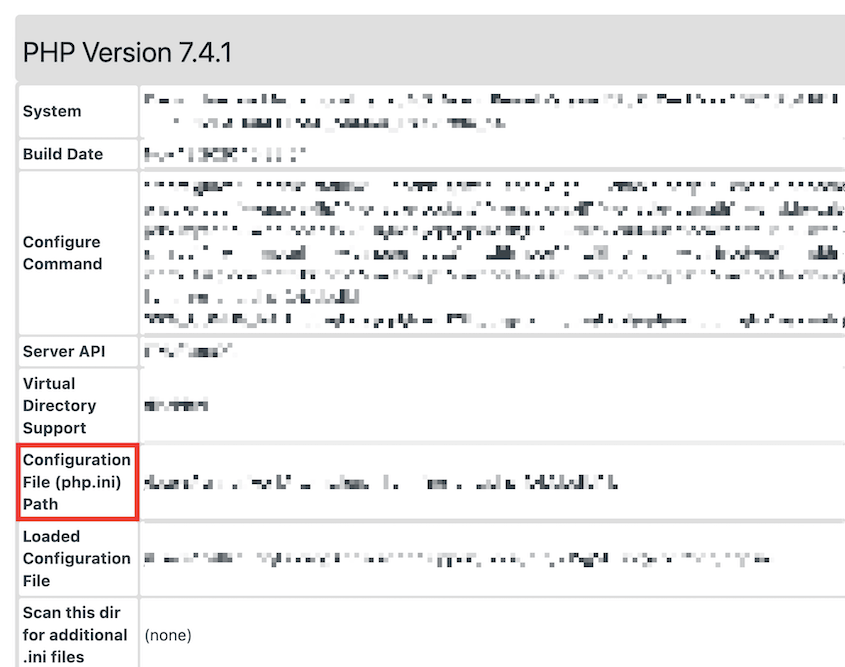
You can also create a new file in your WordPress root directory and name it phpinfo.php. Add this code to it:
<?php phpinfo(); ?>Access this file through your browser with a link like yourdomain.com/phpinfo.php. This will show you your PHP configuration.
In the phpinfo output, look for the Loaded Configuration File entry. This tells you where your php.ini file is located.
Open your php.ini file and look for the following code:
error_reporting = E_ALL

display_errors = On
If they’re not there, add them. If they’re there but set to different values, change them to match the code above.
If you don’t have access to php.ini, you can add these lines to your .htaccess file:
php_value error_reporting E_ALL

php_flag display_errors on
Or, add this to the top of your wp-config.php file:
ini_set('display_errors', 1);

ini_set('display_startup_errors', 1);

ini_set('error_reporting',E_ALL);Method 6. Check For doing_it_wrong()
WordPress has a unique function called _doing_it_wrong() that can be incredibly helpful for developers and site owners. This function is WordPress’s way of telling you that you’re not using something correctly.
First, make sure you have WP_DEBUG enabled in your wp-config.php file.
With debugging enabled, WordPress will now show you messages when it detects improper usage of functions or APIs.
These messages typically look like this:
Warning: {function_name}() was called incorrectly. {message} in {file} on line {line_number}The doing_it_wrong() function provides valuable information like:
- The name of the function being used incorrectly
- A message explaining what’s wrong
- The file and line number where the issue occurs
If it’s in a plugin or theme you’ve developed, update your code to use the correct method. If it’s in a third-party plugin or theme, report the issue to the developer.
Not all doing_it_wrong() messages indicate critical errors, but they’re all worth addressing. Always test thoroughly after making changes based on these messages.
Our Expert Tips for WordPress Debugging
Let’s dive into some pro-level strategies for debugging. These tips will help you become a more efficient and effective troubleshooter, saving you time and headaches in the long run.
- Review Error Log Files: Check wp-content/debug.log for timestamped PHP errors and warnings; clear the log before reproducing an issue to filter out noise
- Use a Staging Site: Debug on an exact copy of your live site in a private environment so you can experiment freely without risking downtime
- Check Server Configuration: Verify your .htaccess rules, PHP version, and server settings as sources of errors that WordPress debug mode won’t catch directly
- Find Developer Tools: Use Chrome DevTools or Firefox Developer Tools to inspect HTML, CSS, JavaScript, and network requests directly in the browser
- Use WP-CLI: Run command-line tools like
wp db checkandwp plugin statusto diagnose issues faster than navigating the admin dashboard - Only Activate Debugging Temporarily: Debug mode can expose sensitive data and slow your site; disable it as soon as you’ve finished troubleshooting
- Don’t Use Too Many Debugging Plugins: Multiple plugins can conflict with each other; stick to one well-reviewed tool that covers your specific needs
- Use a Child Theme: Make theme customizations in a child theme so parent theme updates don’t overwrite your changes or complicate debugging
- Implement Version Control: Track all file changes with Git so you can identify exactly which edit introduced a bug and roll back cleanly
- Keep WordPress Updated: Running current versions of WordPress, themes, and plugins eliminates many known bugs before they ever affect your site
- Collaborate and Seek Help: Use WordPress Stack Exchange, plugin support forums, and the developer community when you’ve hit a wall on your own
1. Review Error Log Files
WordPress typically saves error logs in the wp-content directory. Look for a file named debug.log. If you can’t find it, you might need to create it manually or check with your hosting provider for the correct location.
Each entry in the log usually follows this format:
[Date and Time] PHP Error level: Error message in /path/to/file.php on line XWhen reviewing logs, pay attention to:
- Recurring errors: Are certain issues happening repeatedly?
- Timing of errors: Do problems occur at specific times or after certain actions?
- Severity of errors: Focus on critical errors and warnings first.
2. Use a Staging Site
One of the cardinal rules of WordPress debugging is: never debug on a live site. That’s where staging sites come in.
A staging site allows you to debug and experiment without the stress of breaking your live site. It’s an exact copy of your website that’s in a private and safe testing area.
Whether you’re troubleshooting a tricky bug or testing a major site overhaul, your staging environment is the perfect place to do it. It’s an investment that pays off in site stability and peace of mind.
Many hosting providers offer one-click staging site creation. You can also set up a local development environment.
Here’s some advice I’ve learned from using staging sites:
- Regularly sync your staging site with your live site to ensure you’re testing on an up-to-date version.
- Populate your staging site with actual content from your live site for the most accurate testing.
- Password-protect your staging site to keep it away from prying eyes and search engines.
- Use your staging site to test updates, new plugins, and theme changes before applying them to your live site.
- Keep a log of what you’ve changed on the staging site, so you can easily replicate successful fixes on your live site.
3. Check the Server Configuration
Your server is the engine that powers your WordPress site. It needs the right settings to run smoothly.
The .htaccess file plays a crucial role in how your site interacts with the server. It can contain rules for things like permalinks (custom URLs) and rewrites. Ensure your .htaccess file is configured correctly, especially if you’ve recently made changes.
WordPress has specific PHP version requirements. Check your server’s PHP version and ensure it meets the minimum recommended version for your current WordPress installation. Outdated PHP versions can lead to compatibility issues and security vulnerabilities.
Sometimes, errors might originate from the server itself. If debugging methods aren’t resolving the issue, consider contacting your hosting provider for further assistance. They can help diagnose any server-specific problems that might be affecting your site.
4. Find Developer Tools
Your web browser comes with a powerful set of debugging tools. Learning to use these effectively can significantly boost your WordPress debugging skills.
Many developers use browser extensions like Chrome DevTools or Firefox Developer Tools. These help you troubleshoot issues on the front end of your site.
Here’s what you can do with these tools:
- Inspect HTML, CSS, and JavaScript from a web browser
- Analyze HTTP requests and responses
- Modify HTML structure or CSS styling
- Step through code execution
- Set breakpoints
- Identify slow resources
- Find performance bottlenecks
- And more!
5. Use WP_CLI
WP-CLI (WordPress Command Line Interface) offers a powerful and efficient way to debug your WordPress site. It’s a tool that lets you interact with your WordPress installation directly through commands.
With WP-CLI, you’ll streamline your troubleshooting workflow. Running commands can be much faster than editing files or using the admin dashboard. You can also automate repetitive tasks or create custom scripts for specific debugging needs.
Once installed, you can navigate to your WordPress directory using the command line and run WP-CLI commands. These commands typically start with wp followed by a specific action (e.g., wp user list).
Here are some useful debugging commands to get you started:
- wp db check: Checks the health of your WordPress database.
- wp plugin status: Lists all installed WordPress plugins and their current status (active, inactive, etc.).
- wp theme status: Lists all installed themes and their current status.
- wp debug log: Displays the contents of the WordPress debug log file.
These are just a few examples. The official documentation provides a comprehensive list and detailed explanations for each command.
Remember, using WP-CLI effectively requires some familiarity with the command line. However, its efficiency and power make it a valuable tool for experienced users who want to speed up their debugging process.
6. Only Activate Debugging Temporarily
While WP Debug is a powerful tool, it’s important to remember it’s not meant for permanent use.
Debugging mode can potentially slow down page load times. This is because it displays detailed error messages and logs information that isn’t necessary for normal operation.
Leaving debugging enabled on a live site exposes sensitive information like error messages and database queries. This information could be potentially exploited by hackers.
So, it’s important to only activate debugging temporarily when you’re actively troubleshooting an issue. Here are some best practices:
- Once you’ve implemented a fix, disable debugging by removing the relevant code snippet from your wp-config.php file (for manual debugging) or deactivating the debugging plugin.
- Ideally, use a staging site for debugging. You can freely experiment with debugging methods without bogging down your live site.
- Establish a clear workflow for debugging. This could involve enabling debugging, analyzing the logs and error messages, fixing the problem, and finally disabling debugging again.
By following these guidelines, you’ll troubleshoot without compromising your site’s performance or security.
7. Don’t Use Too Many Debugging Plugins
Debugging plugins offer a convenient way to enable debugging in WordPress. However, there’s a potential downside to relying on too many of them.
Each plugin adds code and resources to your site. Having more than one debugging plugin running simultaneously can slow down your website’s performance.
Different debugging plugins might have overlapping functionalities. This can lead to conflicts and unexpected behavior on your site.
Here’s a more strategic approach to using debugging plugins:
- Identify Your Needs
Before installing a debugging plugin, clearly define the issue you’re trying to troubleshoot. Research plugins that cater to that specific need.
- Start with a Single Plugin
Install a well-reviewed debugging plugin known for its reliability and ease of use. Popular options include Query Monitor, Debug Bar, and WP Debugging.
- Disable Unused Features
Many debugging plugins offer a range of features. Deactivate any you’re not currently using to minimize resource consumption.
8. Use a Child Theme
Child themes offer a safe and effective way to modify your theme’s functionality and appearance without directly editing theme files. This becomes particularly helpful for debugging theme-related issues.
Since you make changes in the child theme, the original theme files remain untouched. New theme updates won’t overwrite your customizations.
If you encounter a problem related to your theme’s code, you can focus your debugging efforts on the child theme files. This simplifies troubleshooting by isolating the potential source of the issue.
Using a child theme allows you to maintain a separate codebase for your customizations. This makes it easier to track changes, revert to previous versions if needed, and collaborate with other developers.
9. Implement Version Control
You’ve made significant changes to your WordPress site, only to encounter a critical issue later. Wouldn’t it be helpful to rewind time and revert to a previous version?
Version control allows you to track all changes made to your WordPress site’s files over time. This creates a history of your site’s revisions.
If you encounter problems after code modifications, you can easily revert to a previous stable version. This can be a lifesaver if something goes wrong during development or debugging.
By analyzing the changes made between different versions, you can pinpoint the exact modification that might have introduced a bug. You’ll significantly streamline the debugging process.
Git is widely used for WordPress version control. I’d recommend starting here if you want to manage your code changes.
10. Keep WordPress Updated
Debugging an issue on an outdated WordPress site can be like chasing a moving target. Regular updates ensure you’re working with the latest stable version, making debugging more efficient and reliable.
By following a consistent update routine, you can maintain a secure, stable, and well-functioning WordPress website. You’re less likely to encounter issues that require extensive debugging, saving you time in the long run.
11. Collaborate and Seek Help
Even experienced WordPress developers face challenges that require additional support. You should never be afraid to ask questions and learn from other people in your field.
Many online forums are dedicated to WordPress troubleshooting. You can describe your debugging issue, share error messages, and get valuable insights from other users and developers.
The WordPress Stack Exchange is a goldmine for WordPress-related queries. Search for existing solutions to your problem or post a detailed question for community assistance.
You can also find dedicated support for themes and plugins on WordPress.org. If you’re encountering an issue with a specific plugin or theme, post in the support forum for troubleshooting guidance.
If you’re a website owner with limited technical experience, consider hiring a professional WordPress developer. They can analyze your problem, identify the root cause, and implement a solution, saving you valuable time and effort.
FAQs About WordPress Debugging
How do I fix debugging errors in WordPress?
The specific steps to fix debugging errors depend on the nature of the issue. However, the general process involves enabling WP debug mode, analyzing logs and error messages, implementing a fix, and finally disabling debugging.
What does debugging actually do?
Debugging is the process of identifying and resolving problems in your WordPress site. It involves enabling debugging mode, reading error logs, and tracing the root cause of malfunctions. By fixing these issues, you can ensure your WordPress site functions at its highest level.
Should debugging be on or off?
Debugging mode should only be enabled temporarily when actively troubleshooting an issue. Leaving it on can negatively impact performance, expose sensitive information, and clutter your admin dashboard with unnecessary messages. Once you’ve resolved the problem, disable debugging to maintain a secure and well-performing website.
How do I know if WP debug is enabled?
Review wp-config.php: Look for code snippets like define('WP_DEBUG', true) or define('WP_DEBUG_LOG', true) within your wp-config.php file. These lines tell you that debugging is enabled.
Keep Your WordPress Site Clean and Error-Free
Instead of waiting for something to break, build regular check-ins into your workflow. Review your error logs, keep software updated, and test changes on a staging site before they go anywhere near production.
A clean debugging process also depends on having a fallback. Before you touch wp-config.php, edit theme files, or start deactivating plugins, take a backup. With Duplicator Pro, that’s a one-click step, and if something goes sideways during troubleshooting, you can restore the whole site just as fast.
Debugging is a lot less stressful when you know you can undo anything. Upgrade to Duplicator Pro for one-click restores and easy disaster recovery!
And don’t underestimate how much easier debugging gets with repetition. The first time you dig through a debug.log file, it feels overwhelming. The tenth time, you’ll know exactly where to look. Build the habit, use the right tools, and the problems that used to take hours will start taking minutes.
While you’re here, I think you’ll like these extra WordPress guides:


